SQL Queries
Available for: timeline snapshots
Known limitation on Windows: Windows Vista and Windows Server 2008 don't support SQL ETW events – The SQL Queries filter doesn't show any data on these operating systems.
The SQL Queries event shows time intervals where your application communicates with an SQL server. This includes time required for opening and closing connections, running commands, performing queries, and other SQL activities. Note that all measurements are performed on the client side – dotTrace measures the time between a client sending a request and it receiving a response.
Select the SQL Queries event to analyze how your app accesses data. For example, a web application may run slowly due to a bottleneck in SQL server communication. In such a case, you can use the SQL Queries filter to determine the slowest queries and methods that run these queries.
After you select the SQL Queries event, you can fine-tune the result with the SQL Queries: Command and SQL Queries: Connection String sub-filters.
dotTrace collects SQL data from the following data providers:
OS | Details |
|---|---|
Windows | .NET Framework:
.NET Core, .NET 5+:
|
Linux and macOS | .NET Core 3.0+, .NET 5+:
|
Entity Framework / Entity Framework Core providers based on the aforementioned technologies are also supported.
dotTrace collects limited data about management commands for OLE DB and ODBC.
If you use OLE DB, the following commands will not be shown in the SQL Queries: Commands sub-filter:
[Open Connection]
[Close Connection]
For ODBC, these are:
[Begin Transaction]
[Commit Transaction]
[Rollback Transaction]
In addition, ODBC and OLE DB do not provide connection data, therefore, in both cases the SQL Queries: Connection String sub-filter will show [Unknown] instead of the connection string.
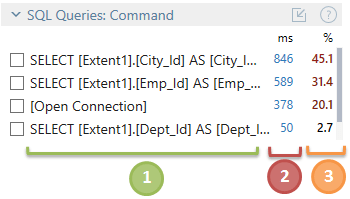
The SQL Queries: Command sub-filter shows distribution of SQL operations time between SQL commands: queries, opening and closing connection commands, and so on. Use this sub-filter to determine how much time a particular command takes.

![]() Command name or query content.
Command name or query content.
![]() Total time spent on an SQL command summed up for all selected threads.
Total time spent on an SQL command summed up for all selected threads.
![]() The percentage of time spent on an SQL command relative to the total selected time.
The percentage of time spent on an SQL command relative to the total selected time.
Select the desired SQL command in the filter.
After you select a command, other filters will show data only for the time intervals where the selected command was performed.

If a command content is too long to fit the Filters window, it is truncated by width. To view the entire content of such a command, open the SQL Queries window. The window shows the same data as the SQL Queries: Command filter but, in addition, it allows finding commands by content and copying the content to clipboard.
Do one of the following:
Use the menu View | SQL Queries.
Click the
.png) button in the SQL Queries: Command filter.
button in the SQL Queries: Command filter.
As well as the SQL Queries: Command filter, the SQL Queries window also can work as a filter by an SQL command.
Do one of the following:
Select the desired SQL command.
Double-click the desired SQL command.
Select the desired SQL command and press Enter
In the context menu of the desired SQL command, choose Select And Clear Others.
Do one of the following:
Select the desired SQL command and press Space.
In the context menu of the desired SQL command, choose Select As Filter.
This will add the SQL command to selection.
In the context menu of the desired SQL query, choose Copy To Clipboard.
In the search field located on top of the SQL Queries window, start typing command (query) content you are looking for. As you type, the list of SQL commands narrows down, suggesting the ones that match the entered string.
For convenience, large commands consisting of multiple rows are truncated.
Do one of the following:
Click the ... button at the end of the command.
In the context menu of the desired SQL command, choose Show Full Query.
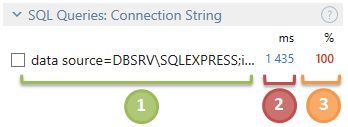
The SQL Queries: Connection String sub-filter shows distribution of SQL Queries time between SQL commands with particular connection parameters. This filter could be useful, for example, if your application communicates with more than one SQL server.

![]() Connection string.
Connection string.
![]() Total time of all SQL commands with these connection parameters.
Total time of all SQL commands with these connection parameters.
![]() The percentage of time spent running SQL commands with these connection parameters relative to the total selected time.
The percentage of time spent running SQL commands with these connection parameters relative to the total selected time.
Select the desired string in the filter.
After you select a connection string, other filters will show data only for the time intervals where threads run SQL commands with corresponding connection parameters.
