File Operations
Available for: timeline snapshots
The File Operations event shows time intervals where file input/output operations took place. This includes reading from and writing to the physical disk and system cache. Therefore, file I/O operations are not equal to disk I/O operations.
File operations are very important for performance analysis as access to the file system might require significant time. For example, if your application frequently reads a particular file, it will be more effective to cache the file data.
Select the File Operations event to evaluate how file operations affect performance, what methods do most of the job, and so on. For example, to determine methods in a thread that perform most of the file I/O operations, select the thread in the Threads diagram and the File Operations event in Events. The methods will be shown on top of the Hotspots in the Call Stack window.
After you select the File Operations event, you can fine-tune the result with the File Operations: File Name and File Operations: Direction sub-filters.
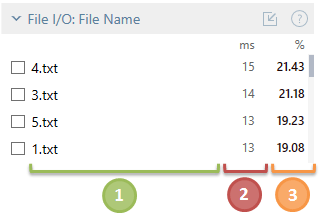
The File Operations: File Name sub-filter shows distribution of file I/O operations time between particular files. Use this sub-filter to determine files your application works with.

![]() File name.
File name.
![]() Total time spent on file I/O operations with the file summed up for all selected threads.
Total time spent on file I/O operations with the file summed up for all selected threads.
![]() The percentage of time spent on file I/O operations with the file relative to the total selected time.
The percentage of time spent on file I/O operations with the file relative to the total selected time.
For example, your application has two threads you are interested in: Thread#1 and Thread#2. Profiling lasted 50 ms. Thread#1 worked with file1.txt for 10 ms and with file2.txt for 30 ms. Thread#2 worked with file1.txt for 5 ms. The Events will show the following:
File Operations 45 ms 45%
If you select the File Operations event, the File Operations: File Name sub-filter will show you the following:
file1.txt 15 ms 15%
file2.txt 30 ms 30%
Select the desired file name in the filter.
After this, other filters will show data only for the time intervals where threads performed file I/O operations with the selected file.

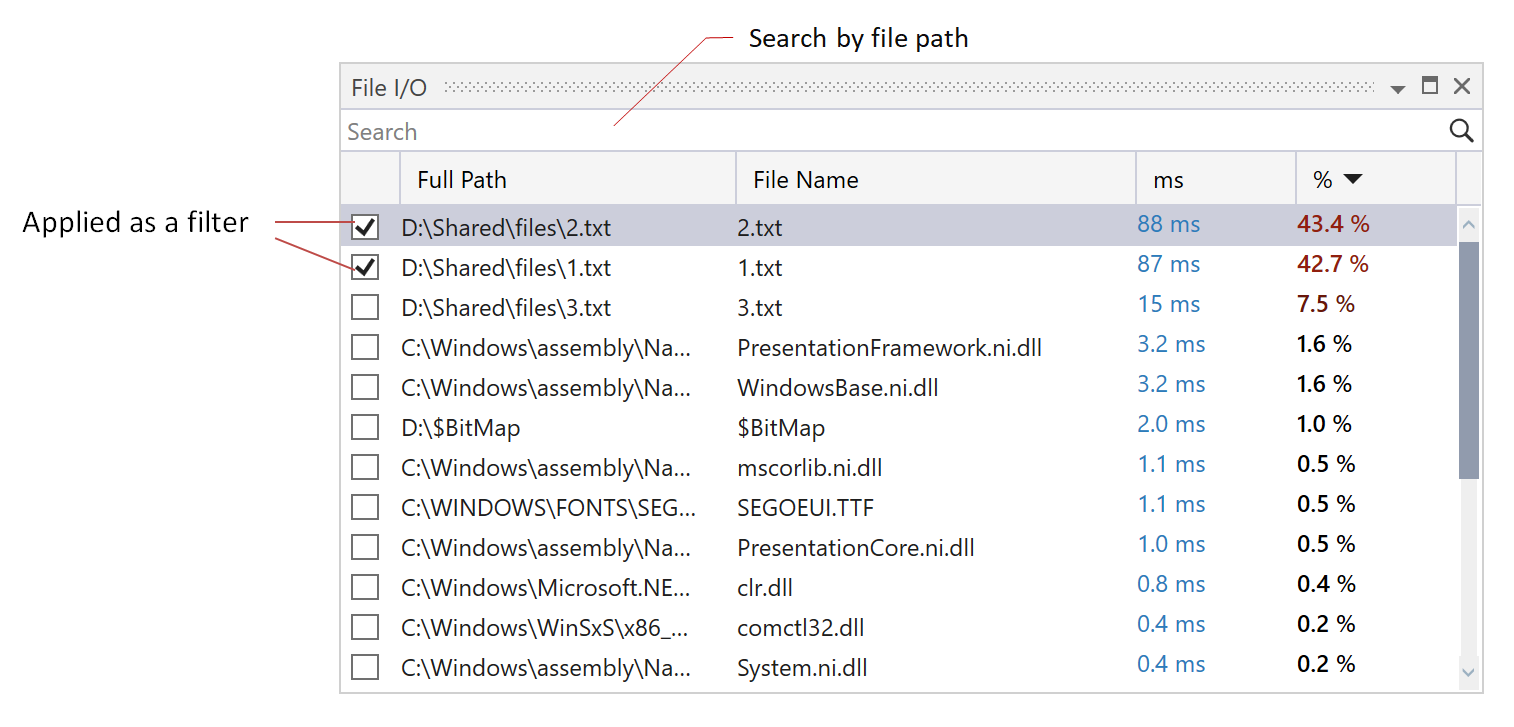
If you want to see the full file path or find a specific file by its path, open the File I/O window.

Do one of the following:
Use the menu View | File I/O.
Click the
.png) button in the File Operations: File Name filter.
button in the File Operations: File Name filter.
As well as the File Operations: File Name filter, the File I/O window also can work as a filter by specific files.
Do one of the following:
Select the desired file.
Double-click the desired file.
Select the desired file and press Enter
In the context menu of the desired file, choose Select And Clear Others.
Do one of the following:
Select the desired file and press Space.
In the context menu of the desired file, choose Select As Filter.
This will add the file to selection.
In the context menu of the desired file, choose Copy To Clipboard.
In the search field located on top of the File I/O window, start typing file's path. As you type, the list of files narrows down, suggesting the ones that match the entered string.
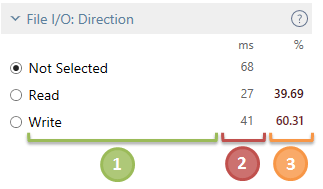
The File Operations: Direction sub-filter shows distribution of file I/O between read and write operations. Use this sub-filter to determine what type of file I/O operations dominates.

![]() I/O direction: Read, Write, or Not Selected which is equal to "the filter is not applied".
I/O direction: Read, Write, or Not Selected which is equal to "the filter is not applied".
![]() Total time spent on read or write operation summed up for all selected threads.
Total time spent on read or write operation summed up for all selected threads.
![]() The percentage of time spent on read or write operation relative to the total selected time.
The percentage of time spent on read or write operation relative to the total selected time.
For example, your application has two threads you are interested in: Thread#1 and Thread#2. Profiling lasted 50 ms. Thread#1 worked read from file1.txt for 10 ms and wrote to it for 15 ms. Thread#2 only read from file1.txt for 20 ms. The Events will show the following:
File Operations 45 ms 45%
If you select the File Operations event, the File Operations: Direction sub-filter will show you the following:
Read 30 ms 30%
Write 15 ms 15%
Not Selected 45 ms
Select the desired direction in the filter.
After you select a direction, other filters will show data only for the time intervals where threads performed the selected type of file I/O operations.
