Thread State
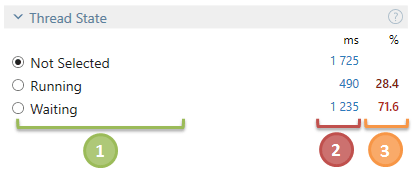
The goal of the Thread State filter is to "Select all time intervals where threads were in the specified state". For example, if you want to analyze only time intervals when a certain thread was not working, select the thread on Threads diagram and the Waiting state in the Thread State filter.
A thread can be only in one of two states at a time:
Running – a thread is running.
Waiting – a thread is not running as it waits for a resource or notification from another thread.

![]() State name.
State name.
![]() Time spent in this state summed up for all selected threads.
Time spent in this state summed up for all selected threads.
![]() The percentage of time spent in this state relative to the total selected time.
The percentage of time spent in this state relative to the total selected time.
To apply the Thread State filter
Select the desired thread state(s) in the filter.
After you select a state, other filters will show data only for the time intervals where threads were in the selected state.

Thread State: Running
Select the Running state when you want to analyze the work done by a certain thread, for example, to find out what method was executed most of the time in a threadю
After you select the Running state, you can fine-tune the resulting filter with the Running: CPU Core sub-filter.
Running: CPU Core
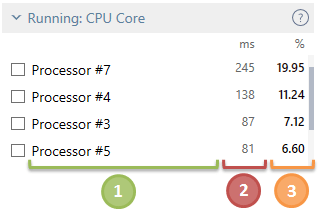
This sub-filter shows distribution of work between logical CPU cores. The filter may be potentially useful in two scenarios:
Evaluate whether it is worth to bind a thread to a single core (too frequent switching between cores leads to additional workload).
Evaluate whether it is worth to divide a thread's job between a number of threads (in case the thread entirely loads a single core while other cores are not loaded).

![]() Logical CPU core number.
Logical CPU core number.
![]() Time when threads were run on this core summed up for all selected threads.
Time when threads were run on this core summed up for all selected threads.
![]() The percentage of time when threads were run on this core relative to the total selected time.
The percentage of time when threads were run on this core relative to the total selected time.
To apply the Running: CPU Core filter
Select the desired logical core(s) in the filter.
After you select a core, other filters will show data only for the time intervals where threads were run on the selected core.

Thread State: Waiting
The Waiting state indicates that a thread is not currently running and is waiting for unlocking. This may be, for example, a result of contention for synchronization objects, garbage collection toggled by other threads, and so on.
Select the Waiting thread state to understand when and why a thread was suspended. For example, to understand how much time a thread waited because of garbage collection on other threads, select the thread in the Threads diagram and the Waiting state in Thread State. The time will be shown in Garbage Collection in the Events filter.
After you select the Waiting state, you can fine-tune the resulting filter with the Waiting: Activated By sub-filter.
Waiting: Activated By
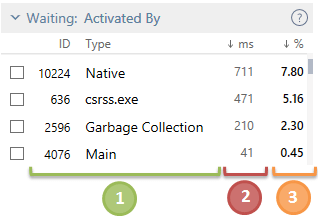
The Waiting: Activated By sub-filter shows threads and processes that unlocked the selected threads. This could be useful when you need to understand who blocked a certain thread.

![]() Thread or process name.
Thread or process name.
![]() Time threads waited before being unblocked by the activating thread or process summed up for all selected threads.
Time threads waited before being unblocked by the activating thread or process summed up for all selected threads.
![]() The percentage of time threads waited before being unblocked by the activating thread or process relative to the total selected time.
The percentage of time threads waited before being unblocked by the activating thread or process relative to the total selected time.
For example, you want to understand who blocked the Main thread in your app. You choose the Main thread in the Threads diagram and the Waiting state in Thread State. The Waiting: Activated By sub-filter shows the following:
Thread#2 90 ms 90%
Thread#1 10 ms 10%
This means that the Main thread was blocked for 100 ms. In 90% of cases (for 90 ms totally) this was because of the Thread#2 and in 10% of cases (for 10 ms totally) because of Thread#1.
To apply the Waiting: Activated By filter
Select the desired activating thread or process in the filter.
After you select a thread or process, other filters will show data only for the time intervals where threads waited before being unblocked by the specified activating thread or process.
