Timeline
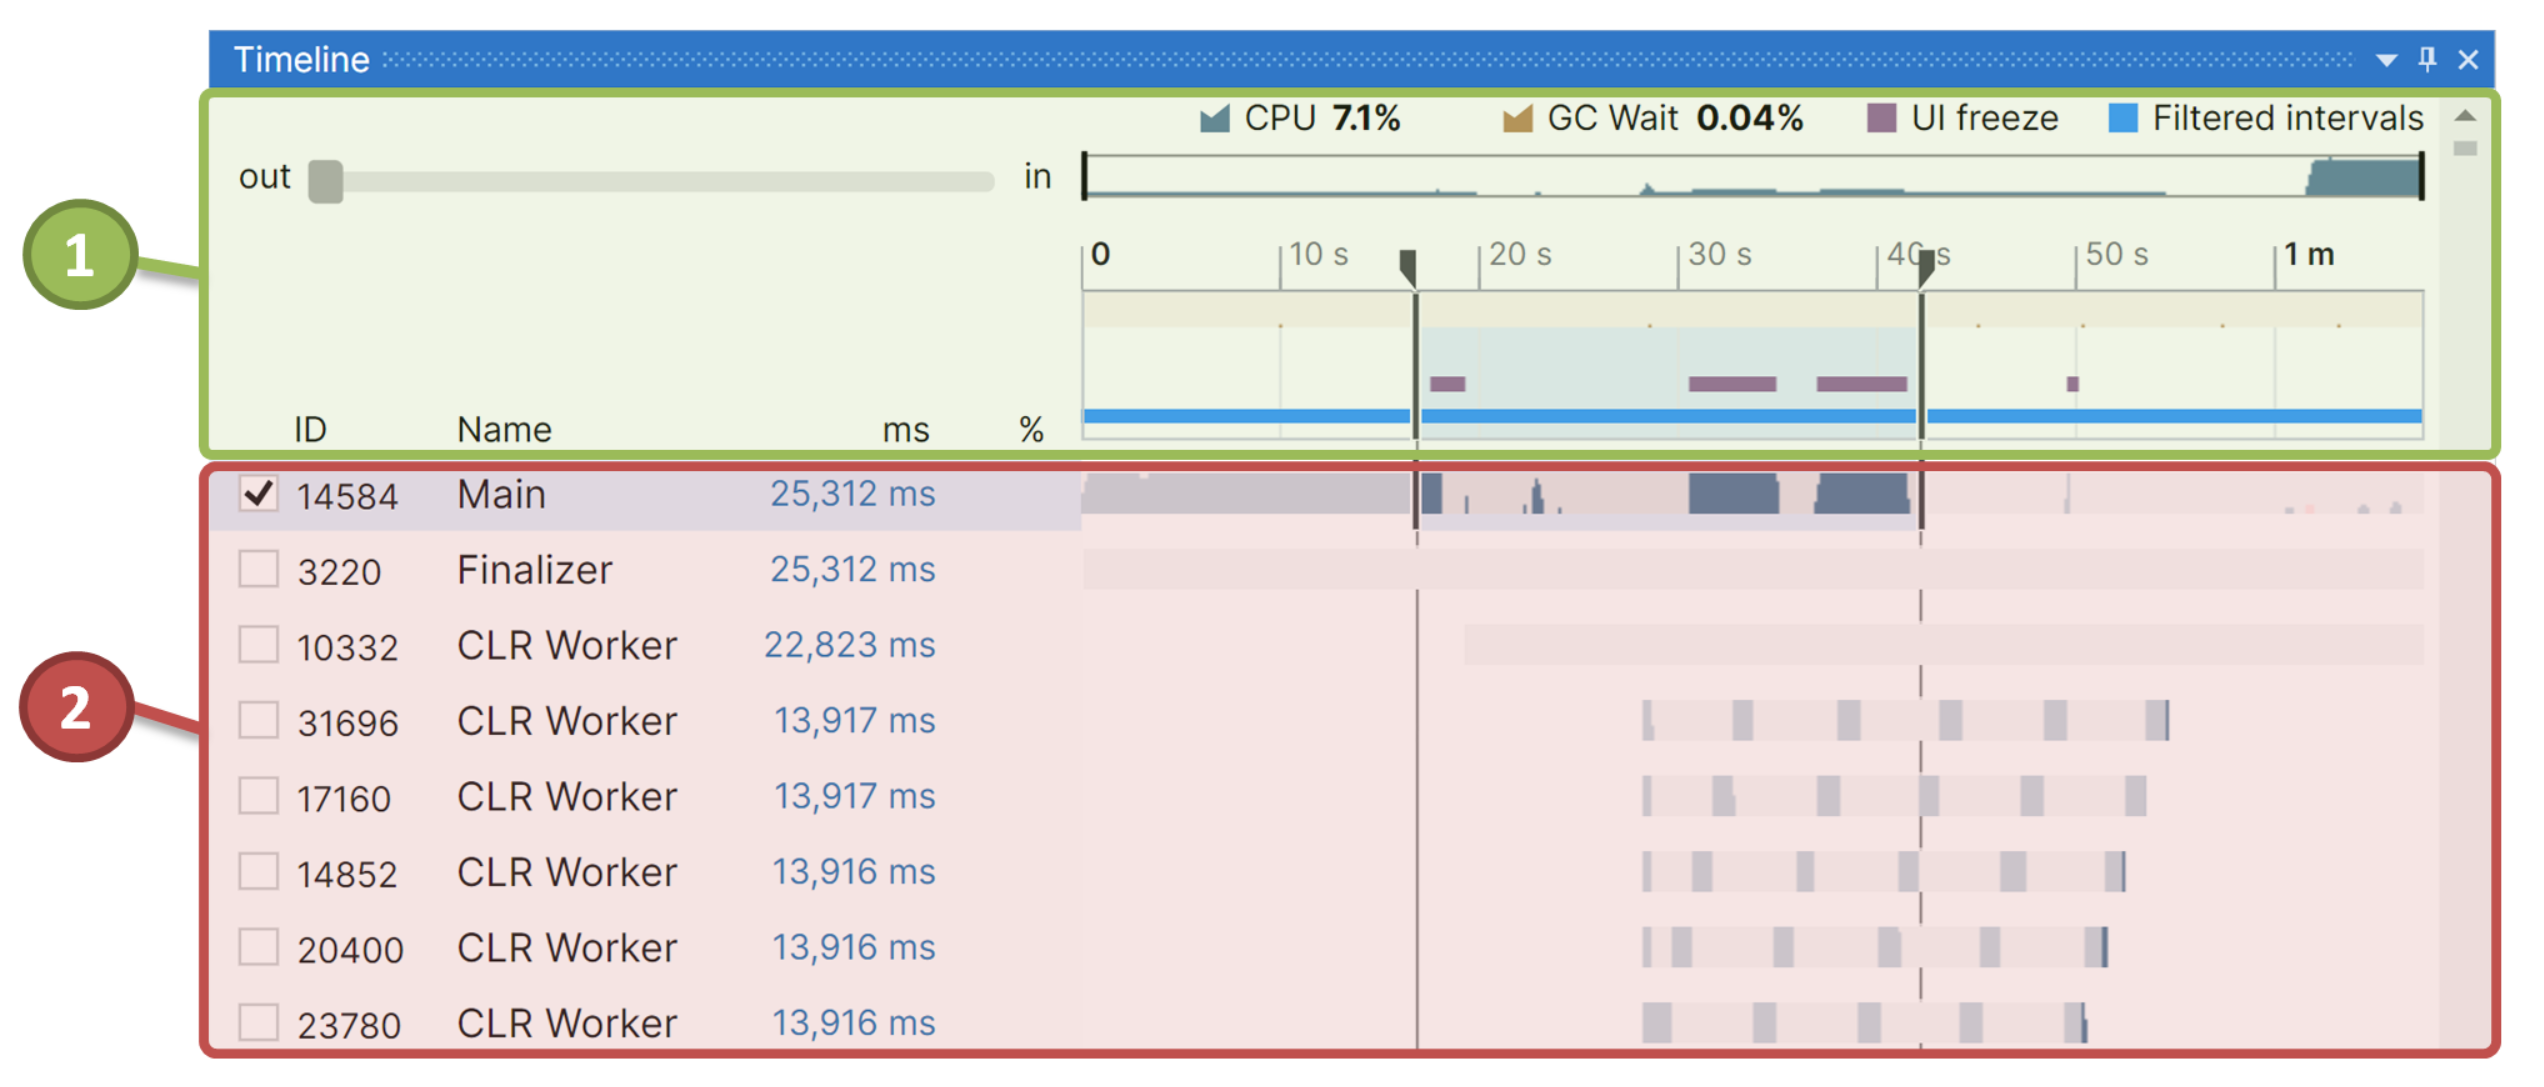
The Timeline window is used to visualize and select threads and time intervals interesting for analysis.

The window consists of the following sections:
![]() Process Overview – Overview diagram of application activity and events.
Process Overview – Overview diagram of application activity and events.
![]() Threads Diagram – Threads activity diagram.
Threads Diagram – Threads activity diagram.
Process overview
The Process Overview diagram visualizes application activity and meaningful events related to the profiled application. Use the diagram to determine and select time intervals that are interesting for analysis, such as intervals with a high CPU load, long blocking GC intervals, and UI freeze intervals.

![]() Timeline Overview
Timeline Overview
Use the overview to evaluate CPU utilization and to quickly navigate in Process Overview and Threads diagrams:
Click anywhere on the overview to select a visible time range. The range size is defined automatically.
Drag the slide bar to select a visible time range.
Move the slide bar edges to change its size.
Use the zoom slider on the left to zoom the Process Overview and Threads diagrams.
![]() Blocking Garbage Collection
Blocking Garbage Collection
Time intervals where the blocking garbage collection (GC) takes place. To perform a blocking GC, CLR suspends all managed threads. For more information about the GC analysis, refer to the Garbage Collection event.
![]() UI Freeze
UI Freeze
Time intervals where the user interface is not responding. More specifically, these are time intervals where window messages are not pumped for more than 200 ms or processing of a particular message takes more than 200 ms.
![]() Filtered Time Intervals
Filtered Time Intervals
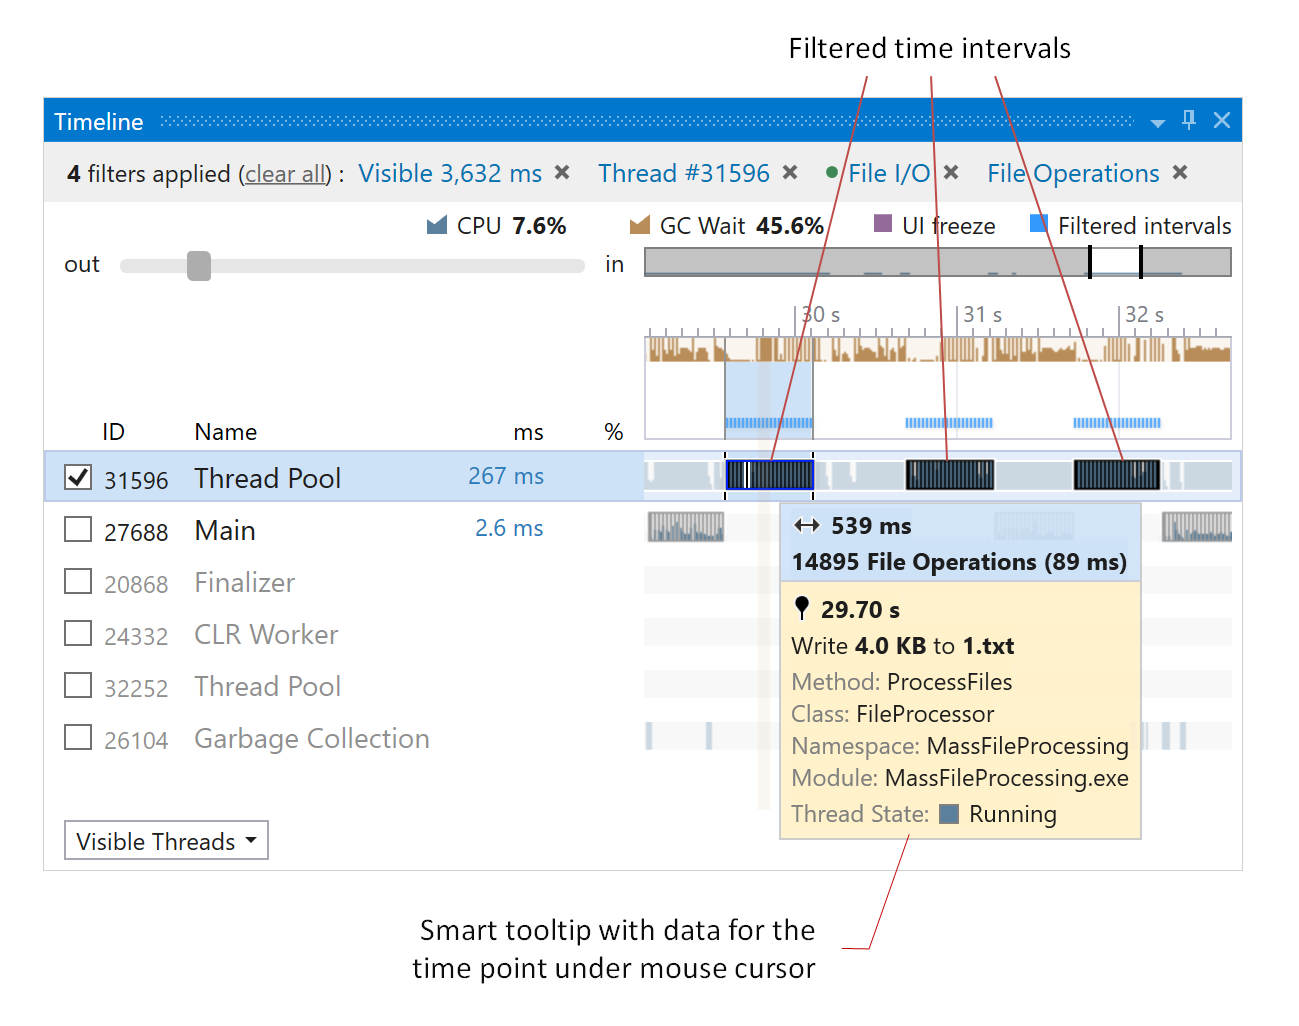
Time intervals that were selected as a result of applying filters.
Threads diagram
The Threads diagram visualizes threads activity and filtered time intervals (in case filters are applied). Use the diagram to select threads and time intervals that are interesting for analysis.

The diagram shows the following data for each thread:
ID | Thread identifier. |
Type | Thread name (shown only for managed threads) or thread type (if a thread does not have a name). dotTrace distinguishes the following thread types:
|
ms / MB / events | Filtered time / allocated memory / number of events. For example, if Not Selected event is selected and no other filters are applied, this will be the entire thread lifetime. If, for instance, you select Waiting in the Thread State filter, this time will be a sum of all Waiting time intervals. |
% | The percentage of the filtered time / allocated memory / number of events relative to all selected time intervals / allocated memory / number of events. |
Thread activity timeline | The timeline distinguishes three thread states: Running, Waiting, Ready (corresponding to the Thread State filter). After you apply any filter, the timeline will highlight the filtered time intervals or point events. Thread timeline can also show detailed info about activity in a particular time point in a smart tooltip. To view the tooltip, hover over a specific time point. Tooltips are context-sensitive and show additional data depending on the selected filters.  |
Select threads
To select specific threads
Click the desired thread(s).
After you select a thread(s), the filter by Thread will be applied. All other filters will show data only for the selected thread(s).
In some cases, it may be convenient to select all threads of a particular type.
To select threads by type
Open the context menu for any thread which belongs to the type you want to select.
In the context menu, choose Select All <Type_Name> Threads.
Hide threads
To simplify analysis, you can hide threads that are not currently interesting (for example, do not perform any work on the selected time interval).
To hide a specific thread
Open the context menu for a thread you want to hide.
In the context menu, select Hide Thread#<ID>.
To hide (non-)selected threads
Select threads.
In the context menu, select Hide Selected Threads or Hide Non-Selected Threads.
To hide threads by type
Open the context menu for any thread which belongs to the type you want to hide.
In the context menu, select Hide All <Type_Name> Threads.
Sort threads
By default, the list of threads is sorted by their creation order. By clicking on the column headers, you can sort threads by other conditions: ID, Type, ms / MB / events, %. The column that is currently used for sorting is marked with the ![]() sign.
sign.
In some cases, it may be convenient to have a certain thread on top of the list regardless of the sorting order. Use the Move to Top option in the thread's context menu to move any thread to the top.
Select time intervals
To select an arbitrary time interval
Drag the mouse over the desired interval holding the left mouse button.
After you select an interval, the Selected Time Interval filter will be applied. All other filters will show data only for this time range.

Use this to analyze time intervals meaningful for analysis. For example, to determine methods that were executed when the CPU load was on maximum.
You can also use the diagram to quickly select UI freeze intervals.
To select a UI freeze time interval
Click a particular UI freeze to select the freeze time interval and the corresponding UI thread. For more information about the freeze analysis, refer to the Interval Filters | UI Freeze filter.
After you select a UI freeze interval, the filters by freeze time interval and the UI thread will be applied. All other filters will show data only for the UI thread and selected time interval.

Zoom the diagram
To zoom in/out the diagram
Do one of the following:
Use the mouse scroll wheel.
Press Ctrl + Drag the mouse holding the left mouse button.
After you zoom the diagram, the Visible Time Interval filter will be applied. All other filters will show data only for the currently visible range.
If a time interval is selected on the diagram, you can zoom in to this interval.
To zoom in to the selected time interval
Press Ctrl + O or select Zoom to Selection in the context menu.
After this the selected time range will take the entire diagram.
Pan the diagram
Drag the mouse holding the right mouse button.