Events
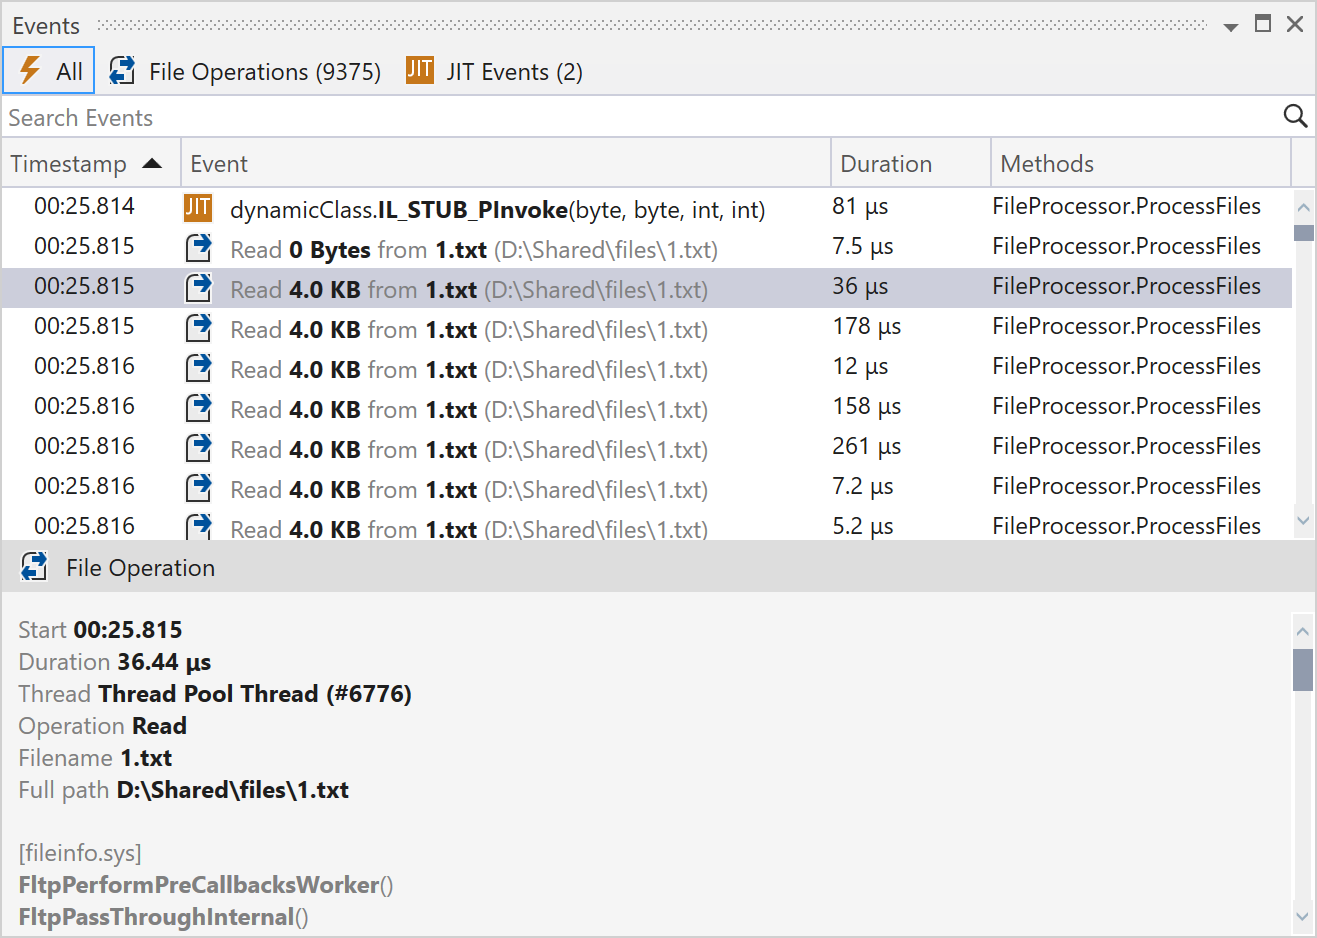
The Events window shows the list of events (JIT, File I/O, SQL Requests, Incoming HTTP Requests) that take place on the selected time intervals. By default, events are shown in the order they occurred.

Use the Events window as any other event log - for analyzing complex cases and bugs when the data provided by other filters is not enough. For example, using filters, you have found that your application writes to a particular file 10 times and writing takes too much time. With the Events window, you can go even deeper and find out which of those 10 events have the longest duration.
To open the Events window
From the main menu, select .
The table of events consists of the following columns:
Start. Event starting time point (time is counted from the beginning of the profiling session).
Event. Detailed event info. For example, for a file I/O event, the cell will contain an I/O operation, data size, filename and file path.
Call Info. The name of the method that originates the event.
Show and hide events by type
In some cases, you might want to view only events of a particular type, e.g. only HTTP requests.
To view events of a particular type
Click the corresponding button at the top of the window: File Operations, Incoming HTTP Requests, SQL Requests, JIT, or Exceptions. If you need to view events of more than one type, click the corresponding buttons while holding the Ctrl key.
Find events
You can find particular events based on the content of the Event column.
To find an event
Place the caret into the Search Events field at the top of the Events window.
Start typing the info about the event you want. For example, for the file I/O event this could be a file I/O operation type and/or a filename.
All events that do not match your search request will be hidden.
View event details
The Events window allows you to get more information about a particular event, e.g., stack trace data.
To view details for a particular event
Click the event you need.
After this, the additional data will be shown in the bottom part of the Events window.