Java, Kotlin, and Groovy
All Qodana linters are based on JetBrains IDEs designed for particular programming languages and frameworks. To analyze Java projects, you can use the following linters:
Characteristic | Description |
|---|---|
Linter name |
|
Docker image |
|
Based on | IntelliJ IDEA Ultimate |
Available under licenses | Ultimate and Ultimate Plus licenses |
Shipped as | A native solution and a Docker image |
Supported languages | Java, Kotlin, Groovy, JavaScript, TypeScript |
Characteristic | Description |
|---|---|
Linter name |
|
Docker image |
|
Based on | IntelliJ IDEA Ultimate |
Available under licenses | Ultimate and Ultimate Plus licenses |
Shipped as | A Docker image |
Supported languages | Java, Kotlin, Groovy, JavaScript, TypeScript |
Characteristic | Description |
|---|---|
Linter name |
|
Docker image |
|
Based on | IntelliJ IDEA Community Edition |
Available under licenses | Community license |
Shipped as | A native solution and a Docker image |
Supported languages | Java, Kotlin, Groovy |
Characteristic | Description |
|---|---|
Linter name |
|
Docker image |
|
Based on | IntelliJ IDEA Community Edition |
Available under licenses | Community license |
Shipped as | A Docker image |
Supported languages | Java, Kotlin, Groovy |
To see the list of supported technologies and features, you can navigate to the Supported technologies and features chapter of this section.
Before you start
Before running Qodana, you may need to configure the JDK for your project.
Qodana Cloud
Depending on the specific linter you're using, you may need to get a project token that will be used by Qodana for identifying and verifying a license. To do this, follow these steps:
Navigate to Qodana Cloud and create an account there.
In Qodana Cloud, create an organization, a team, and a project.
On the project card, you can find the project token that you will be using further in this section.
Prepare your software
On the tab of the GitHub UI, create the QODANA_TOKEN encrypted secret and save the project token as its value.
In Jenkins, make sure that these plugins are up and running:
Docker and Docker Pipeline are required for running Docker images
Git is required for Git operations in Jenkins projects
Make sure that Docker is installed and accessible to Jenkins.
If applicable, make sure that Docker is accessible to the
jenkinsuser as described in the Manage Docker as a non-root user section of the Docker documentation.In Jenkins, create the
qodana-tokencredential and save the project token as its value.In Jenkins, create a Multibranch Pipeline project as described on the Jenkins documentation portal.
Make sure that your project repository is accessible to GitLab CI/CD.
In GitLab CI/CD, create the
QODANA_TOKENvariable and save the project token as its value.
In TeamCity, Create a project and a build configuration.
Install Docker on the machine you are going to run Qodana.
If you are using Linux, you should be able to run Docker under your current non-root user.
Follow the instructions from the Qodana CLI page on GitHub.
Run this command to pull the Docker image of a required linter:
Here, <image> refers to one of the following Docker images:
Docker image | Description |
|---|---|
| Qodana for JVM |
| Qodana Community for JVM |
| Qodana Community for Android |
| Qodana for Android |
K2 Mode
The K2 mode is by default enabled for the Qodana for JVM and Qodana Community for JVM linters.
To revert the K2 mode, in your linter configuration set the idea.kotlin.plugin.use.k2 property to false.
JDK configuration
If your project uses Gradle, make sure that you have configured a JDK version for your project as explained in the JDK configuration section.
Run Qodana
You can run Qodana linters using the following methods:
Native mode as the recommended method for running linters without Docker
Container mode using Docker containers of Qodana
You can run Qodana using the Qodana Scan GitHub action.
To analyze the main branch, release branches and the pull requests coming to your repository in native mode, save this workflow configuration to the .github/workflows/code_quality.yml file:
This configuration uses the --linter option to specify a linter. The --within-docker option in the false state is used for enabling native mode.
More configuration examples are available in the GitHub Actions section.
Run this command in the project root directory:
This configuration uses the --linter option to specify a linter. The --within-docker option in the false state is used for enabling native mode.
If you are using another Qodana Cloud instance than https://qodana.cloud/, override it by declaring the QODANA_ENDPOINT environment variable.
In your browser, open Qodana Cloud to examine the analysis results and reconfigure the analysis. See the Analysis reports section of the documentation for full details.
Container mode is available for all linters; however, it is advised that you use native mode whenever possible.
To analyze the main branch, release branches and the pull requests coming to your repository in container mode, save this workflow configuration to the .github/workflows/code_quality.yml file:
More configuration examples are available in the GitHub Actions section.
Save this configuration to the Jenkinsfile:
More configuration examples are available in the Jenkins section.
In the root directory of your project, save this snippet to the .gitlab-ci.yml file:
More configuration examples are available in the GitLab CI/CD section.
In the TeamCity UI, navigate to the configuration page of a build where you would like to run Qodana.
On the page, click the button.
On the page that opens, select the runner.
On the page, click and configure the runner:
uniquely identifies this step among other build steps.
uniquely identifies this step among other build steps.
configures the build condition that will trigger this build step.
sets the directory for the build process, see the TeamCity documentation for details. You can leave this field empty if the
Checkout directoryparameter is specified on the tab.uniquely identifies the report to let you distinguish between multiple reports when several analysis steps are configured within a single build.
The checkbox configures Qodana report availability in the Test tab of the TeamCity UI. Using this option, you can view codebase problems along with other problems detected.
configures the Qodana linter.
Here, select either the Qodana for JVM, Qodana Community for JVM or Qodana Community for Android linter.
is by default set to
Latest.defines an inspection profile:
qodana.starter (default)is one of the default profiles.Profile namelets you specify a profile, see the Existing Qodana profiles section for details.Profile pathlets you specify the path to your custom profile. To use this option, make sure that you also configure the custom profile in theqodana.yamlfile.
configures a project token generated in Qodana Cloud.
configure the arguments accepted by a Docker image, see the Configuration options section for details.
let you extend the default Qodana functionality, see the Types of options section for details.
lets you specify the Qodana CLI version that you would like to use.
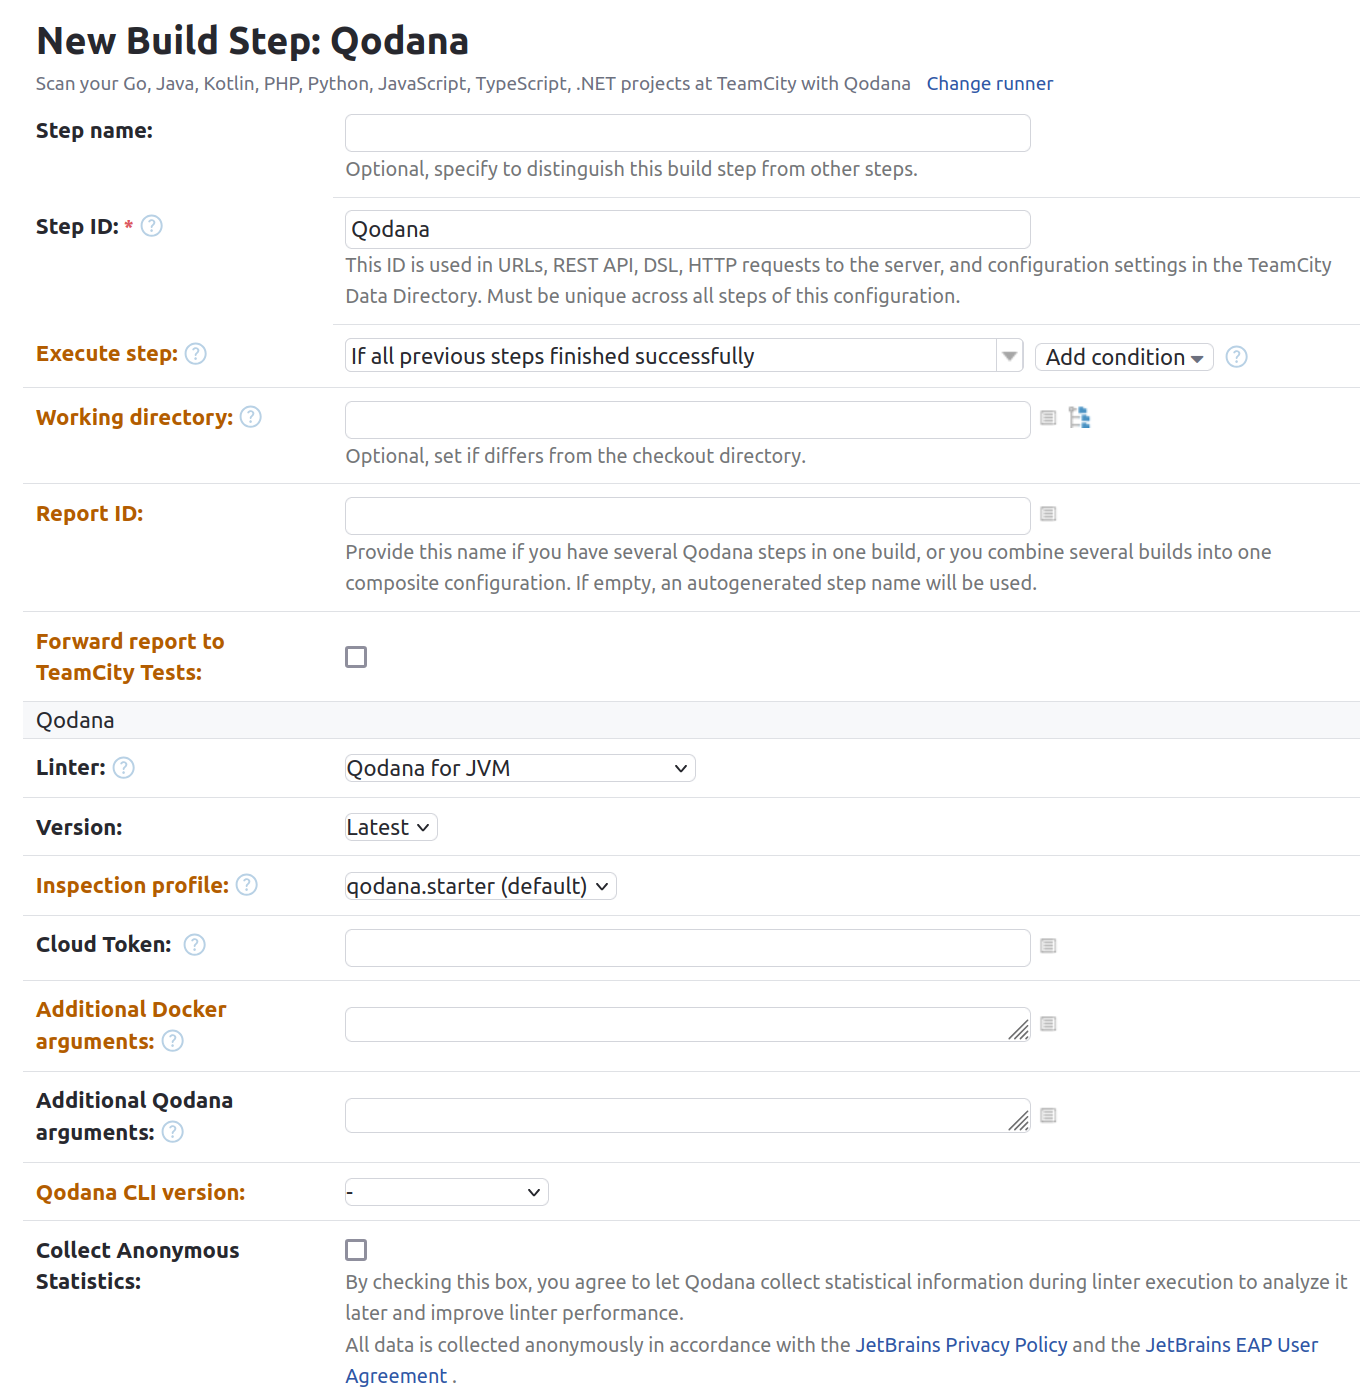
Click the button.
More configuration examples are available in the TeamCity section.
If you are using another Qodana Cloud instance than https://qodana.cloud/, override it by declaring the QODANA_ENDPOINT environment variable.
In your browser, open Qodana Cloud to examine the analysis results and reconfigure the analysis. See the Analysis reports section of the documentation for full details.
In IntelliJ IDEA Ultimate, navigate to .
On the dialog, you can configure Qodana.
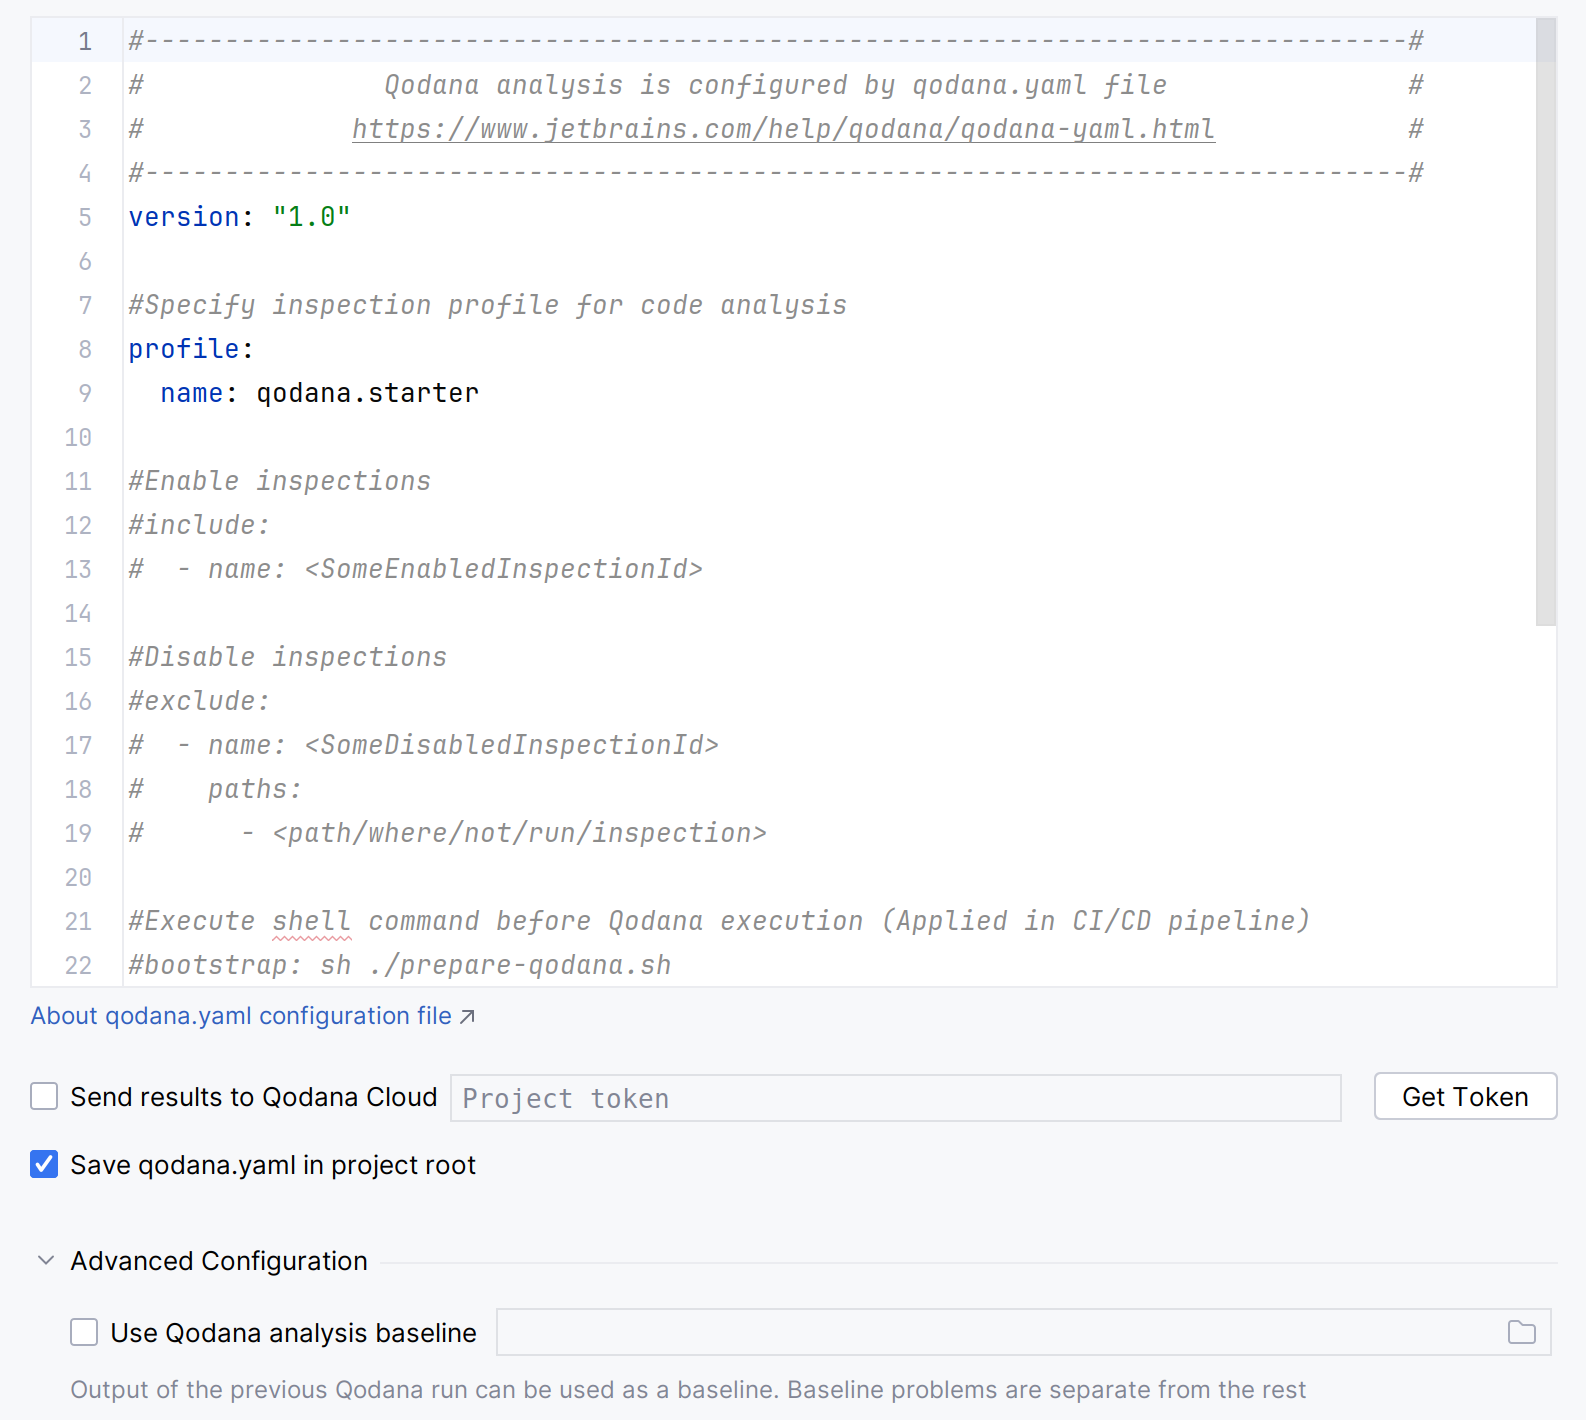
This dialog contains the following components:
Name
Description
The
qodana.yamlfileIn the text field, you can set up code analysis used by Qodana in this file. You can learn more about available configuration options
The option
If you want to send reports to Qodana Cloud, you can check this option and paste the project token generated in Qodana Cloud
The option
By checking this option, you can save the Qodana configuration made on this dialog to the
qodana.yamlfile in the project root of your projectThe option
Using the baseline feature, you can skip analysis for specific problems
Click for analyzing your code.
On the tab of the tool window, see the analysis results.
Explore analysis results
You can load the latest Qodana report from Qodana Cloud to IntelliJ IDEA Ultimate as explained below.
In IntelliJ IDEA Ultimate, navigate to .
On the dialog, click .
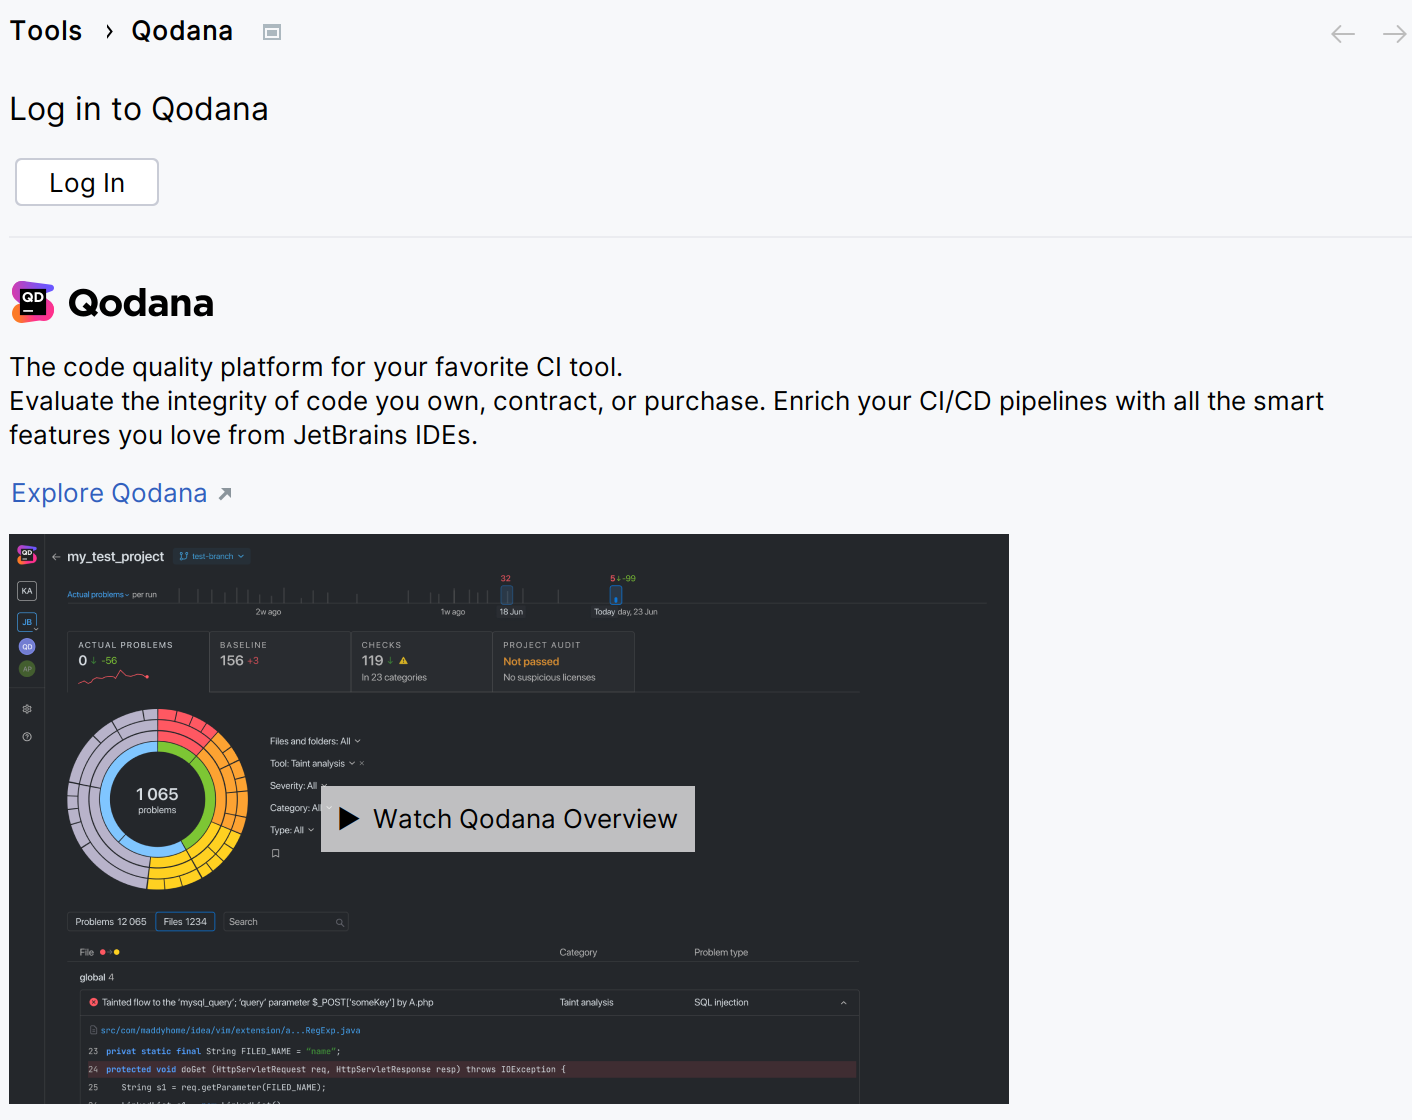
This will redirect you to the authentication page.
Select the Qodana Cloud project to link your local project with.
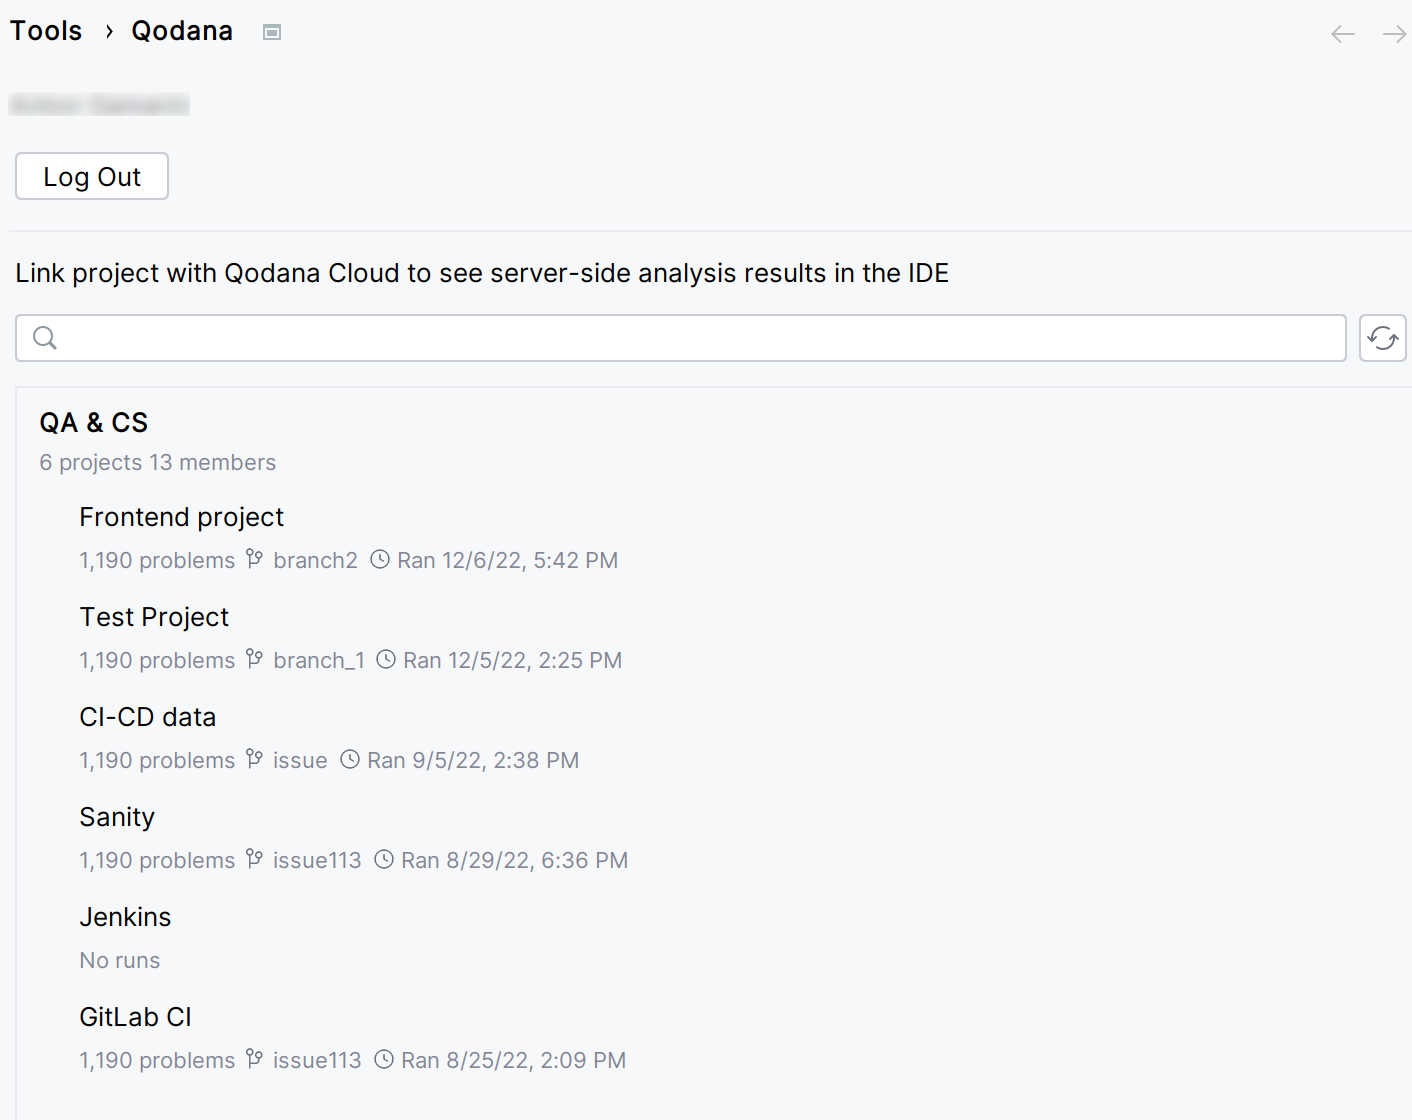
If you check the option, you will be able to receive the most actual and relevant reports from Qodana Cloud.
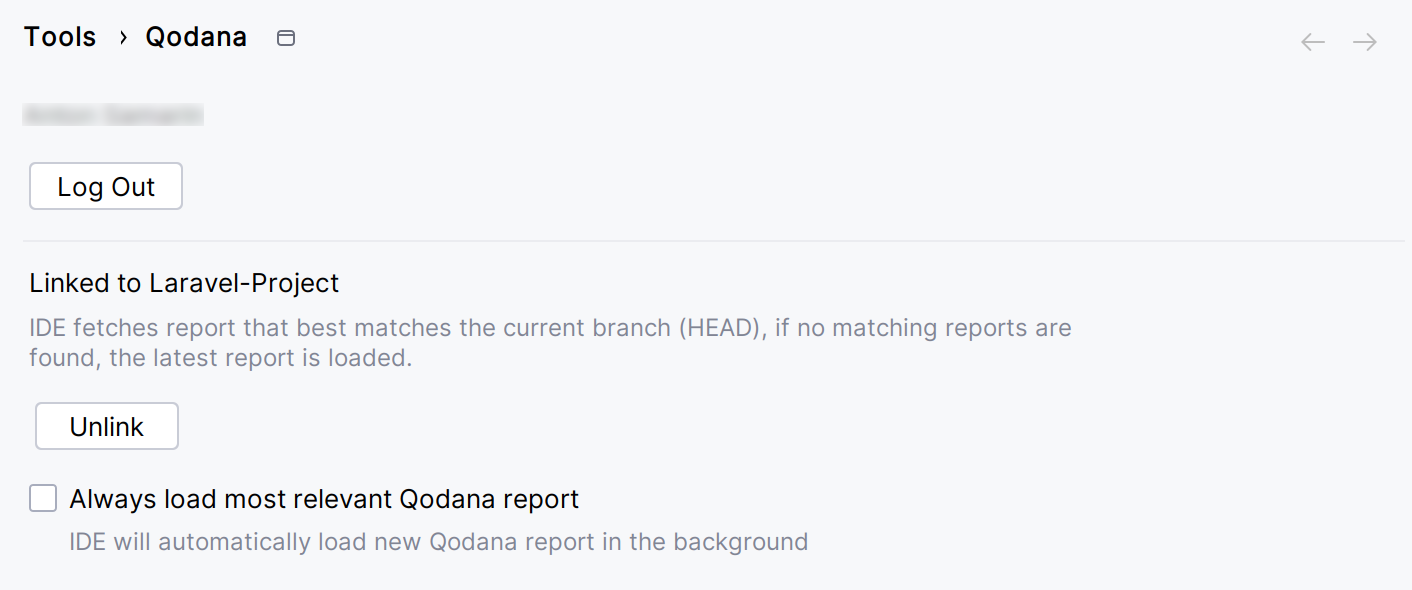
In this case, the IDE will search Qodana Cloud and fetch the report with the revision ID corresponding to the current revision ID (HEAD). If this report is not found, the IDE will select the previous report with the revision ID closest to the current revision ID (HEAD). Otherwise, the IDE retrieves the latest available report from Qodana Cloud.
On the tab of the tool window, you can view the analysis results.
After Qodana analyzed your project and uploaded the analysis results to Qodana Cloud, in Qodana Cloud navigate to your project and review the analysis results report.

To learn more about Qodana report UI, see the Analysis reports section.
Extend Qodana configuration
Adjusting the scope of analysis
Out of the box, Qodana provides two predefined profiles hosted on GitHub:
qodana.starteris the default profile and a subset of the more comprehensiveqodana.recommendedprofile.qodana.recommendedis suitable for running in CI/CD pipelines and mostly implements the default IntelliJ IDEA Ultimate profile; see the IntelliJ IDEA Ultimate documentation for details.
You can customize Qodana profiles using configurations in YAML and XML formats.
Enabling the baseline feature
You can skip analysis for specific problems by using the baseline feature. Information about a baseline is contained in a SARIF-formatted file.
Save the snippet to the .github/workflows/code_quality.yml file containing the --baseline option that specifies the path to a SARIF-formatted baseline file:
Run this command in the project root directory using the --baseline option to specify the path to a SARIF-formatted file containing a baseline:
In your browser, open Qodana Cloud to examine the analysis results and reconfigure the analysis. See the Analysis reports section of the documentation for full details.
Save this snippet to the .github/workflows/code_quality.yml file containing the args: --baseline,qodana.sarif.json option that specifies the path to the SARIF-formatted baseline file:
In the Jenkinsfile, save the configuration containing the --baseline <path/to/qodana.sarif.json> line that specifies the path to the SARIF-formatted baseline file:
In the root directory of your project, save this snippet to the .gitlab-ci.yml file and uncomment the linter that you would like to employ:
The --baseline <path/to/qodana.sarif.json> line in the script block invokes the baseline feature.
In the TeamCity UI, navigate to the configuration page of a build where you would like to run Qodana.
On the page, click the button.
On the page that opens, select the runner.
On the page, click and configure the runner:
uniquely identifies this step among other build steps.
uniquely identifies this step among other build steps.
configures the build condition that will trigger this build step.
sets the directory for the build process, see the TeamCity documentation for details. You can leave this field empty if the
Checkout directoryparameter is specified on the tab.uniquely identifies the report to let you distinguish between multiple reports when several analysis steps are configured within a single build.
The checkbox configures Qodana report availability in the Test tab of the TeamCity UI. Using this option, you can view codebase problems along with other problems detected.
configures the Qodana linter.
Here, select either the Qodana for JVM, Qodana Community for JVM or Qodana Community for Android linter.
is by default set to
Latest.defines an inspection profile:
qodana.starter (default)is one of the default profiles.Profile namelets you specify a profile, see the Existing Qodana profiles section for details.Profile pathlets you specify the path to your custom profile. To use this option, make sure that you also configure the custom profile in theqodana.yamlfile.
configures a project token generated in Qodana Cloud.
configure the arguments accepted by a Docker image, see the Configuration options section for details.
let you extend the default Qodana functionality, see the Types of options section for details.
In this field, specify the baseline feature using the
--baseline <path/to/qodana.sarif.json>option.lets you specify the Qodana CLI version that you would like to use.

Click the button.
Choose how you would like to run the baseline feature from the command line:
Here, <image> refers to one of the following Docker images:
Docker image | Description |
|---|---|
| Qodana for JVM |
| Qodana Community for JVM |
| Qodana Community for Android |
| Qodana for Android |
Here, <image> refers to one of the following Docker images:
Docker image | Description |
|---|---|
| Qodana for JVM |
| Qodana Community for JVM |
| Qodana Community for Android |
| Qodana for Android |
In IntelliJ IDEA Ultimate, navigate to the tool window.
In the tool window, click the tab.
On the tab, click the button.
On the dialog that opens, expand the section and specify the path to the baseline file, and then click .
Enabling the quality gate
Depending on the linter, you can configure quality gates for:
The total number of project problems, available for all linters
Multiple quality gates for problem severities, available for all linters
Code coverage thresholds, available for the Qodana for JVM and Qodana for Android linters
You can configure quality gates for the total number of project problems, specific problem severities and code coverage by saving this snippet to the qodana.yaml file:
You can configure quality gates for the total number of project problems and specific problem severities by saving this snippet to the qodana.yaml file:
Analyzing pull requests
The Qodana Scan GitHub action automatically analyzes all pull requests, so you do not have to provide any additional configuration. Save this configuration to the .github/workflows/code_quality.yml file:
To analyze changes in your code, employ the --diff-start option and specify a hash of the commit that will act as a base for comparison:
In your browser, open Qodana Cloud to examine the analysis results and reconfigure the analysis. See the Analysis reports section of the documentation for full details.
The Qodana Scan GitHub action automatically analyzes all pull requests, so you do not have to provide any additional configuration. Save this configuration to the .github/workflows/code_quality.yml file:
In the root directory of your project, save the .gitlab-ci.yml file containing the following snippet:
This configuration enables merge request analysis.
Information about configuring TeamCity for analyzing pull and merge requests is available on the TeamCity documentation portal.
To analyze changes in your code, employ the --diff-start option and specify a hash of the commit that will act as a base for comparison:
Here, <image> refers to one of the following Docker images:
Docker image | Description |
|---|---|
| Qodana for JVM |
| Qodana Community for JVM |
| Qodana Community for Android |
| Qodana for Android |
Here, <image> refers to one of the following Docker images:
Docker image | Description |
|---|---|
| Qodana for JVM |
| Qodana Community for JVM |
| Qodana Community for Android |
| Qodana for Android |
Supported technologies and features
Support for | Name | Qodana for JVM and Qodana for Android | Qodana Community for JVM | Qodana Community for Android |
|---|---|---|---|---|
Programming languages | Java Kotlin Groovy JavaScript and TypeScript | ✔ ✔ ✔ ✔ | ✔ ✔ ✔
| ✔ ✔ ✔
|
Frameworks and libraries | JavaBeans JUnit Lombok TestNG JPA Reactive Streams JavaFX Java EE JAX-RS JSP Spring Node.js React Ktor Vue Apache Velocity Android Room | ✔ ✔ ✔ ✔ ✔ ✔
✔ ✔ ✔ ✔ ✔ ✔ ✔ ✔ ✔ ✔ | ✔ ✔ ✔ ✔
| ✔ ✔
✔
✔
|
Databases and ORM | Hibernate ORM MongoDB Oracle MySQL PostgreSQL SQL SQL server | ✔ ✔ ✔ ✔ ✔ ✔ ✔ |
|
|
Markup languages | CSS FreeMarker HTML JSON and JSON5 RELAX NG XML XPath XSLT YAML TOML Less SASS/SCSS PostCSS JSONPath | ✔ ✔ ✔ ✔ ✔ ✔ ✔ ✔ ✔ ✔ ✔ ✔ ✔ ✔ |
✔ ✔ ✔ ✔
|
✔ ✔ ✔ ✔
✔ ✔
|
Scripting languages | Shell script Expression Language (EL) | ✔ ✔ |
| ✔
|
Build management | Gradle Maven | ✔ ✔ | ✔ ✔ | ✔ ✔ |
Other | Regular expressions Structural search HTTP Client | ✔ ✔ ✔ | ✔ ✔
| ✔ ✔
|
Qodana features | ✔ ✔ ✔ ✔ ✔ ✔ ✔ ✔ ✔ ✔ | ✔ ✔
| ✔ ✔
|
* Available only under the Ultimate Plus license.
** Supported only by the Qodana for JVM linter. Available only under the Ultimate Plus license.