Code coverage
Code coverage uses generated reports to calculate the overall code coverage inside a method, class, and file. It also reports on the issues associated with the missing coverage in these entities.
This feature is available under the Ultimate and Ultimate Plus licenses in the following linters:
Linter | Code coverage tool | Supported report file extensions |
|---|---|---|
IntelliJ IDEA Code Coverage Agent is the recommended tool |
| |
| ||
| ||
| ||
| ||
| ||
|
|
How code coverage works
For the missing code coverage issues, the predefined threshold in Qodana is currently set to 50%.
Code coverage uses several inspections that are already included in the qodana.recommended and qodana.starter default inspection profiles, so you do not need to enable them:
Linter | Employed inspection |
|---|---|
Once analysis is complete, reports are available in Qodana reports and JetBrains IDEs.
Code coverage calculation
Qodana calculates code coverage based on the number of code lines containing logic with function, method, and class statements being ignored. Here is the snippet containing comments on how it works:
Before you start
Configure your code coverage tool. For example, Jest code coverage reports should contain paths relative to a project root. If your codebase files are contained in the
<project-root>/src/directory, then reports should containsrc/<file-name>file paths.Use your code coverage tool to generate coverage reports. These reports should be saved to the
<project-root>/.qodana/code-coveragedirectory. You can copy the coverage report file by using theboostrapkey, for example:boostrap: copy path/to/coverage/file <project-root>/.qodana/code-coverageTo learn how to override the
<project-root>/.qodana/code-coveragedirectory, see the recommendation from the Run code coverage chapter.For a monorepo project containing multiple repositories, this directory should be created in each repository.
Prepare your project. If you have a monorepo project, save Qodana configuration for each repository in a separate
qodana.yamlfile. You can put these files in repository directories, or give them custom names and save them in the root directory of a project.For the Qodana for .NET linter, add the
coverlet.msbuildandcoverlet.collectorpackages to the test project. Also, for the Qodana for .NET linter check whether a code coverage report contains information about generated files.
Run code coverage
To learn more about running code coverage using the Qodana for .NET linter, skip to the Qodana for .NET section of this page.
Map the directory containing code coverage reports to the /data/coverage directory and a project token using the QODANA_TOKEN variable. Here are the Docker and Qodana CLI command samples:
If you have a monorepo project, use the -i <path-relative-to-project-root> option to point a repository directory. If you saved Qodana configuration files under custom names, use the --config <path-relative-to-project-root> option. To override the default code coverage report directory, use the --coverage-dir <path-relative-to-project-root> option.
Create the pipeline that will store all code coverage output files in the <project-root-dir>/.qodana/code-coverage directory. You can find various examples of the GitHub Actions configurations on the GitHub website.
Below is the pipeline configuration example for the Qodana for JS linter running in the JS/jest directory of a repository:
If you have a monorepo project and saved Qodana configuration files under custom names, then in the args block use the --config,<path-relative-to-project-root> option. To override the default code coverage report directory, use the --coverage-dir,<path-relative-to-project-root> option.
Create a GitLab CI/CD pipeline that will read all generated code coverage output files from the .qodana/coverage directory using the --coverage-dir option:
If you have a monorepo project and saved Qodana configuration files under custom names, then add the --config,<path-relative-to-project-root> option to args:
Create a pipeline that will read all generated code coverage output files from the .qodana/coverage directory using the --coverage-dir option:
In this configuration, the args: block maps the results of code coverage analysis to the /data/coverage directory.
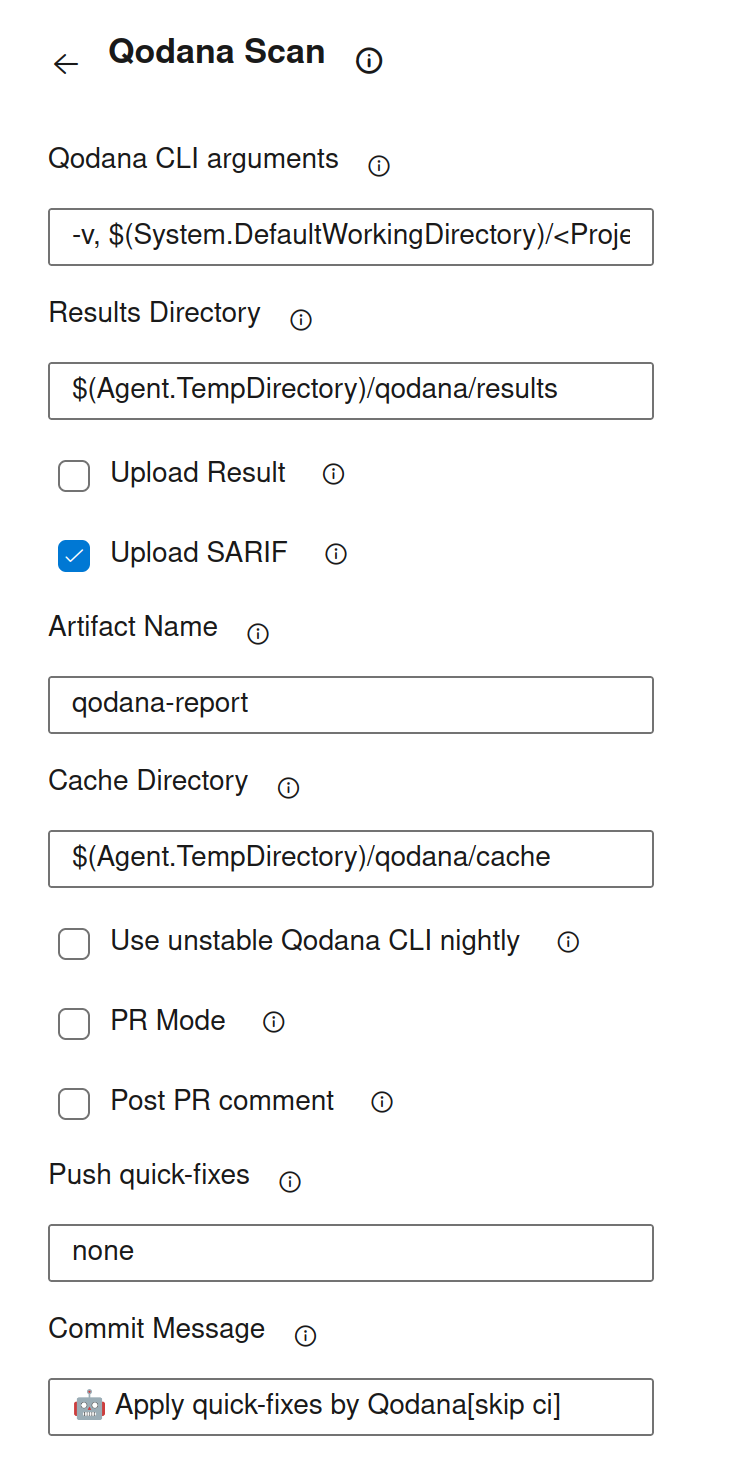
Use the field to map the results of code coverage analysis to the /data/coverage directory. For example, this can be the $(System.DefaultWorkingDirectory)/<ProjectPath> directory:
Qodana for .NET
Here is an example of the qodana.yaml file configuration for the Qodana for .NET linter:
Here, the dotnet option configures the solution file.
The bootstrap key performs several steps before running Qodana:
Command step | Description |
|---|---|
| Build a project or a solution |
| Navigate to the directory containing the project test file |
| Add the |
| Execute tests in the project, and: |
| Enable code coverage |
| Collect code coverage results to a specific directory |
| Specify the code coverage output format |
If a code coverage report file contains information about generated files, exclude this information by adding one or both of the following lines to the dotnet test ... line:
Here is the description of these lines:
Command step | Description |
|---|---|
| Exclude methods or classes marked with specific attributes |
| Excludes files matching a pattern (e.g., |
Code coverage analysis results for the Qodana for .NET linter are available in Qodana Cloud.
Fresh code
Fresh code is the code contained in a GitHub pull request. Qodana can calculate fresh code coverage and display the results.
To enable the fresh code feature, configure the PR-mode in your GitHub workflow.
Here is the sample for inspecting the JavaScript fresh code:
Report overview
After you have prepared the project and ran the code coverage, you can view code coverage reports in Qodana Cloud or using your IDE.
Qodana Cloud
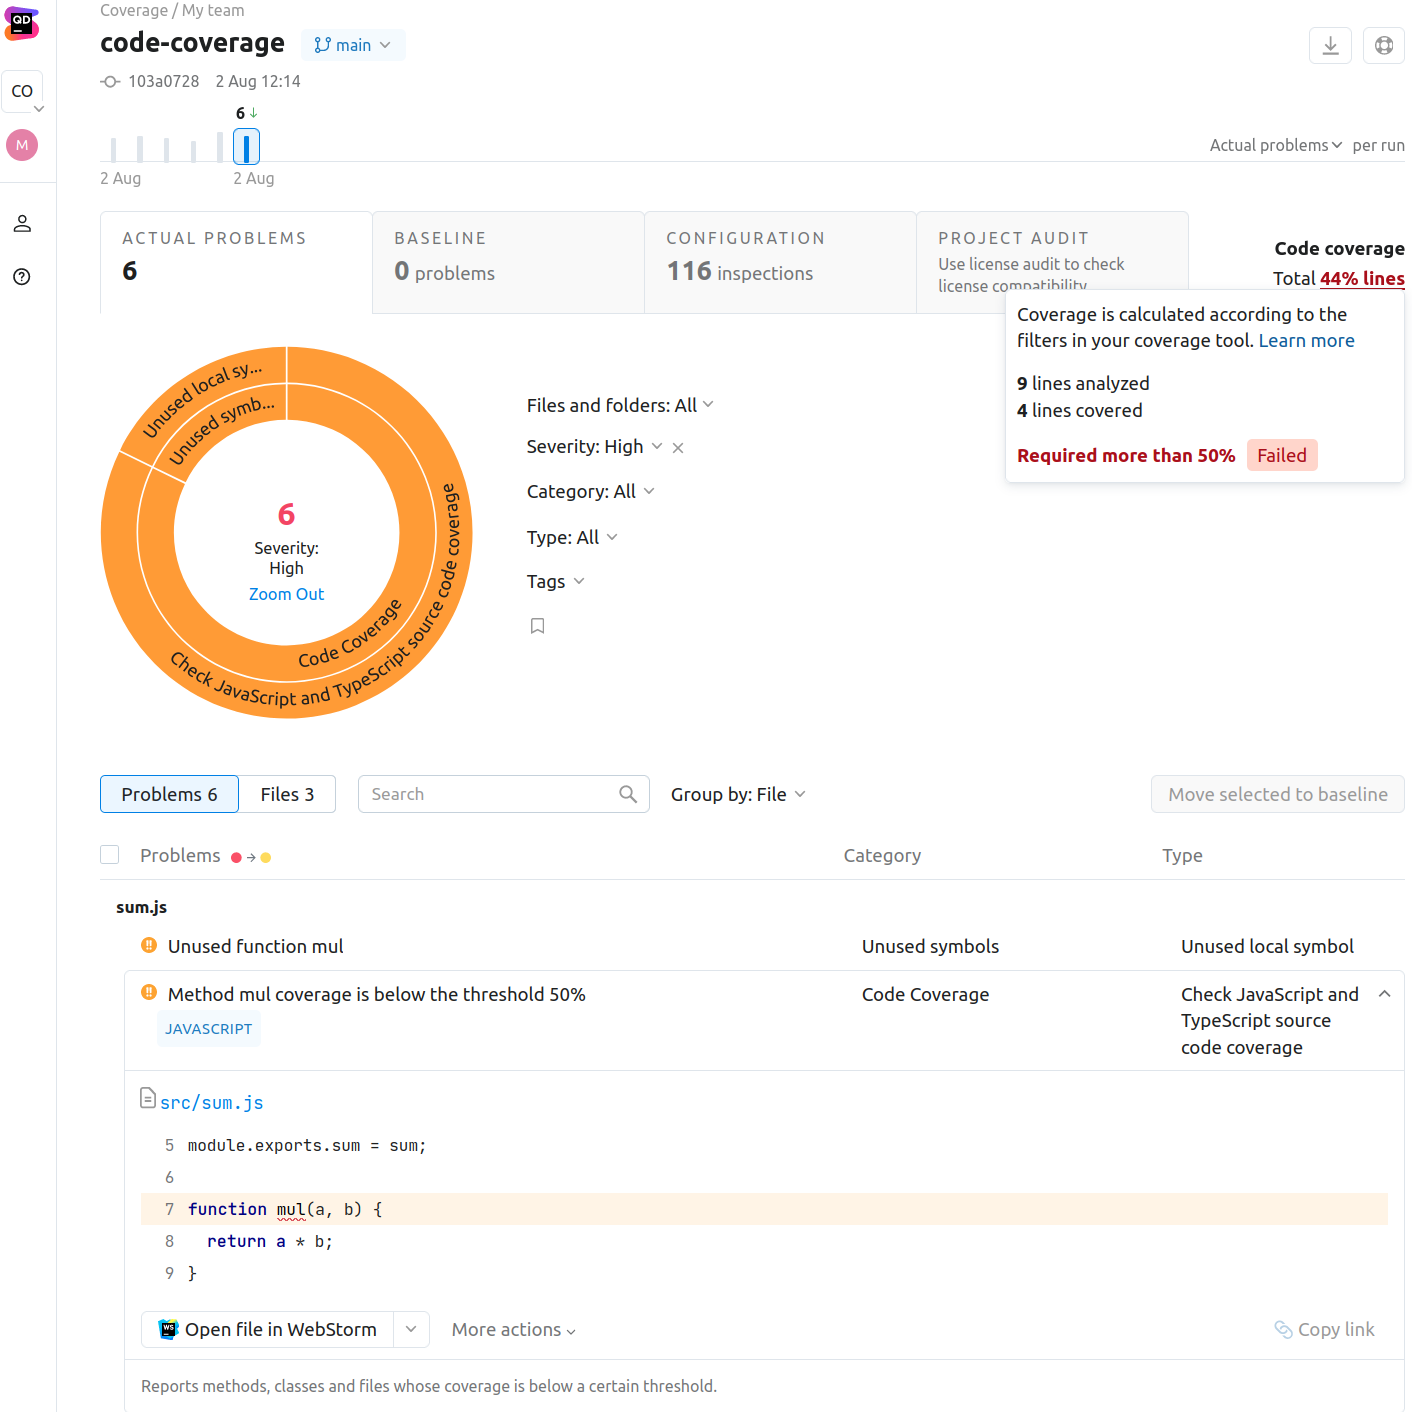
You can find code coverage statistics in the upper-right corner of the Qodana report UI. It also lists the inspections used by the feature.
IDE
You can view code coverage reports using IntelliJ IDEA, WebStorm, PhpStorm, PyCharm, and GoLand IDEs starting from version 2023.2. This feature is available for reports retrieved from Qodana Cloud after linking, or reports from local storage.
Open reports from Qodana Cloud
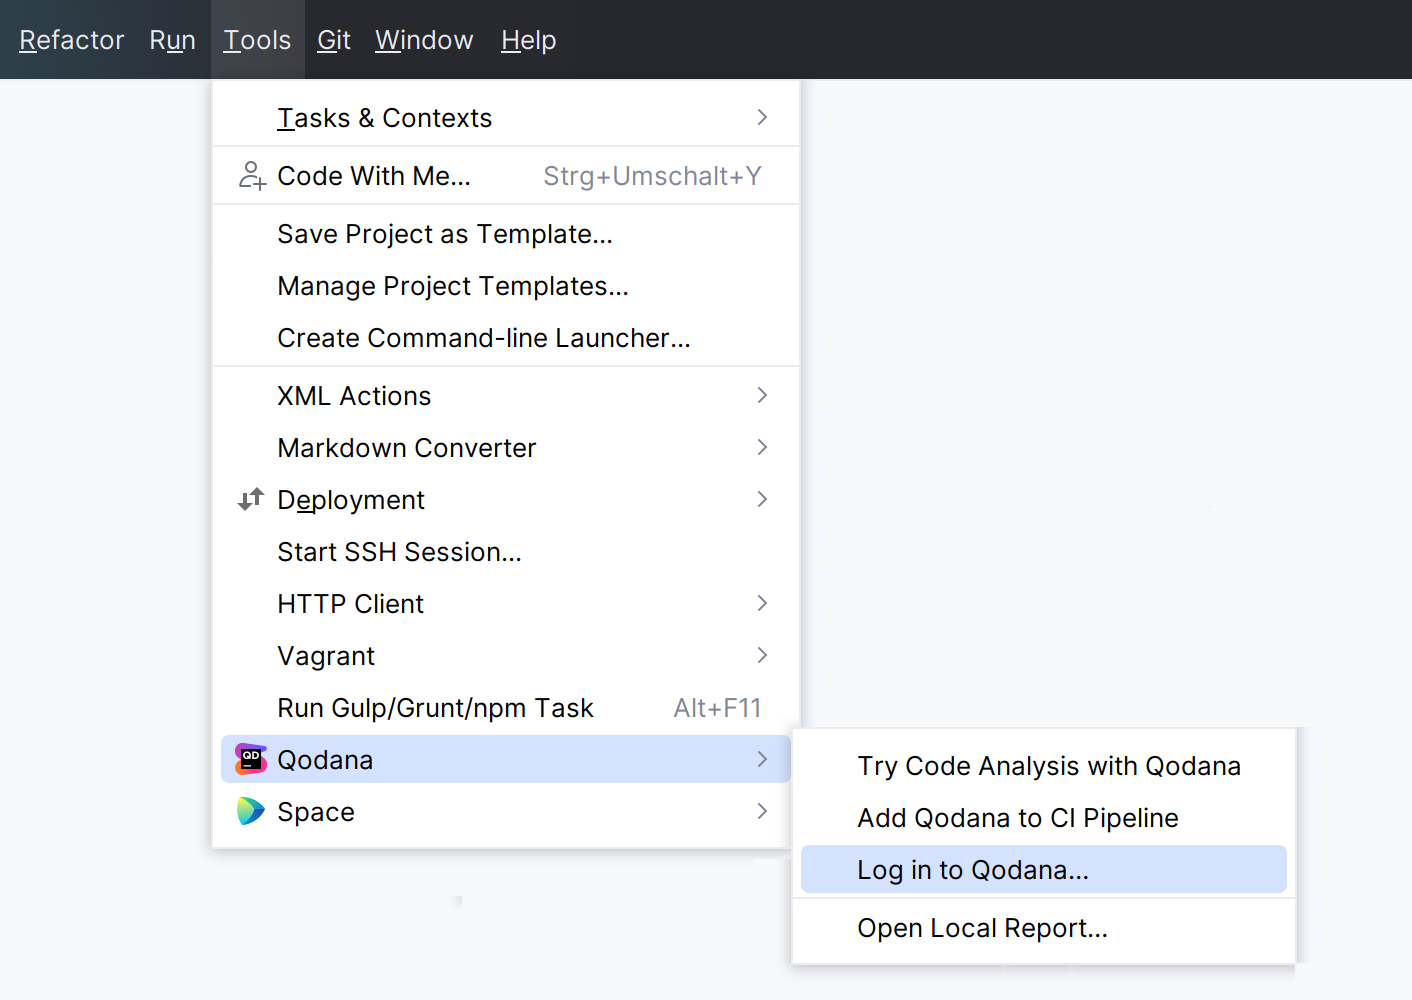
In your IDE, navigate to .
On the dialog, click .
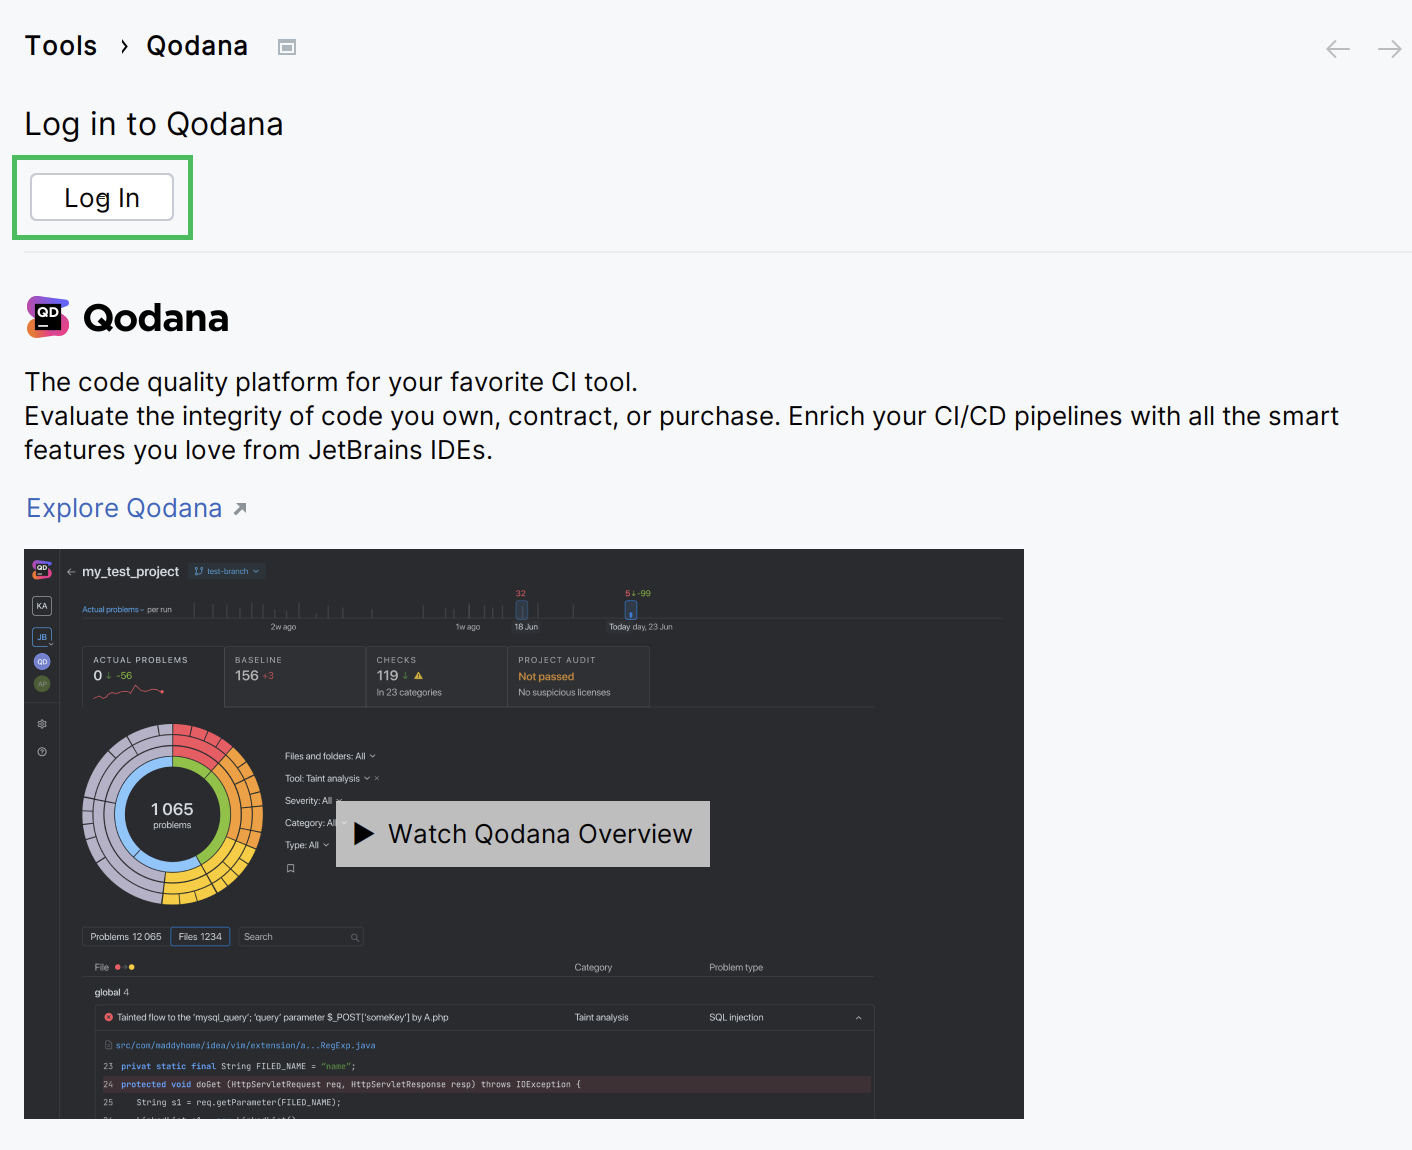
This will redirect you to the authentication page.
In the dialog, search for the project you would like to link with.
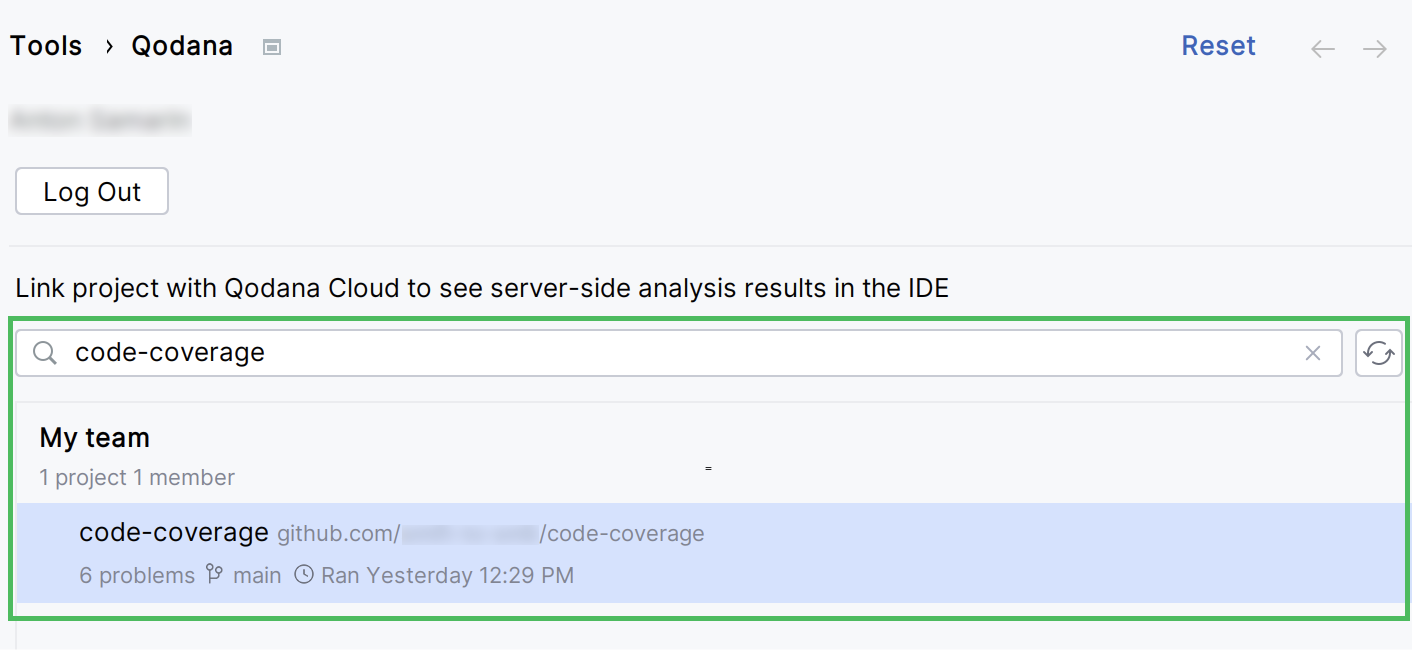
View coverage reports in IDE
You can view code coverage reports based locally using JetBrains IDEs.
In your IDE, navigate to and open the file containing a code coverage report.
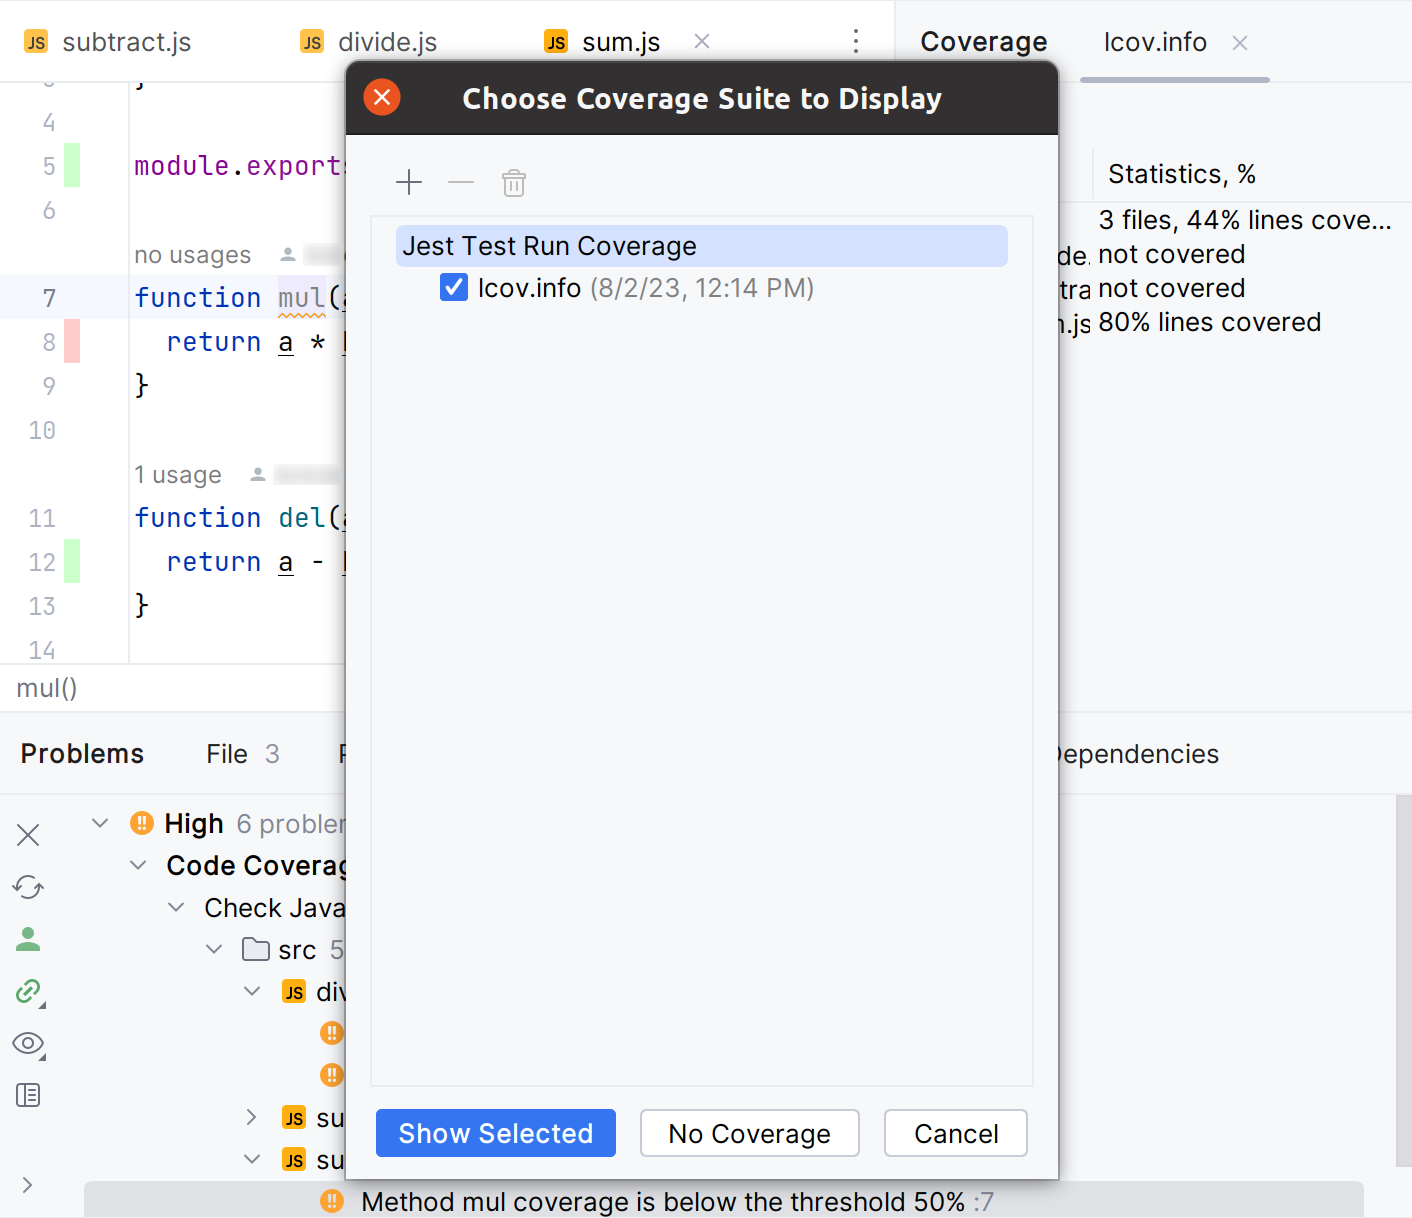
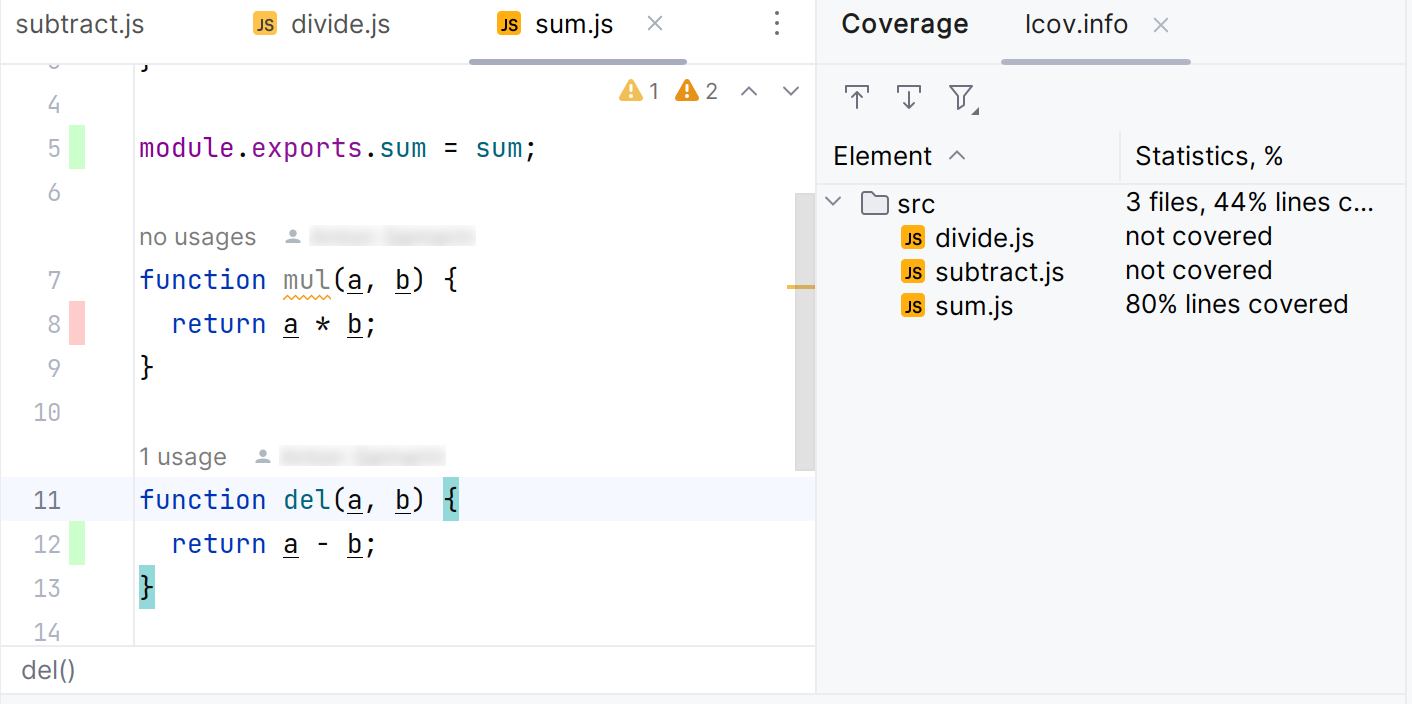
In the tool window, you can view the test coverage report. This report shows the percentage of the code that has been executed or covered by tests.
Report overview
The IDE highlights the codebase test coverage using color marking. By default, the green color means that a particular line was covered, and the red color means the uncovered line of code.
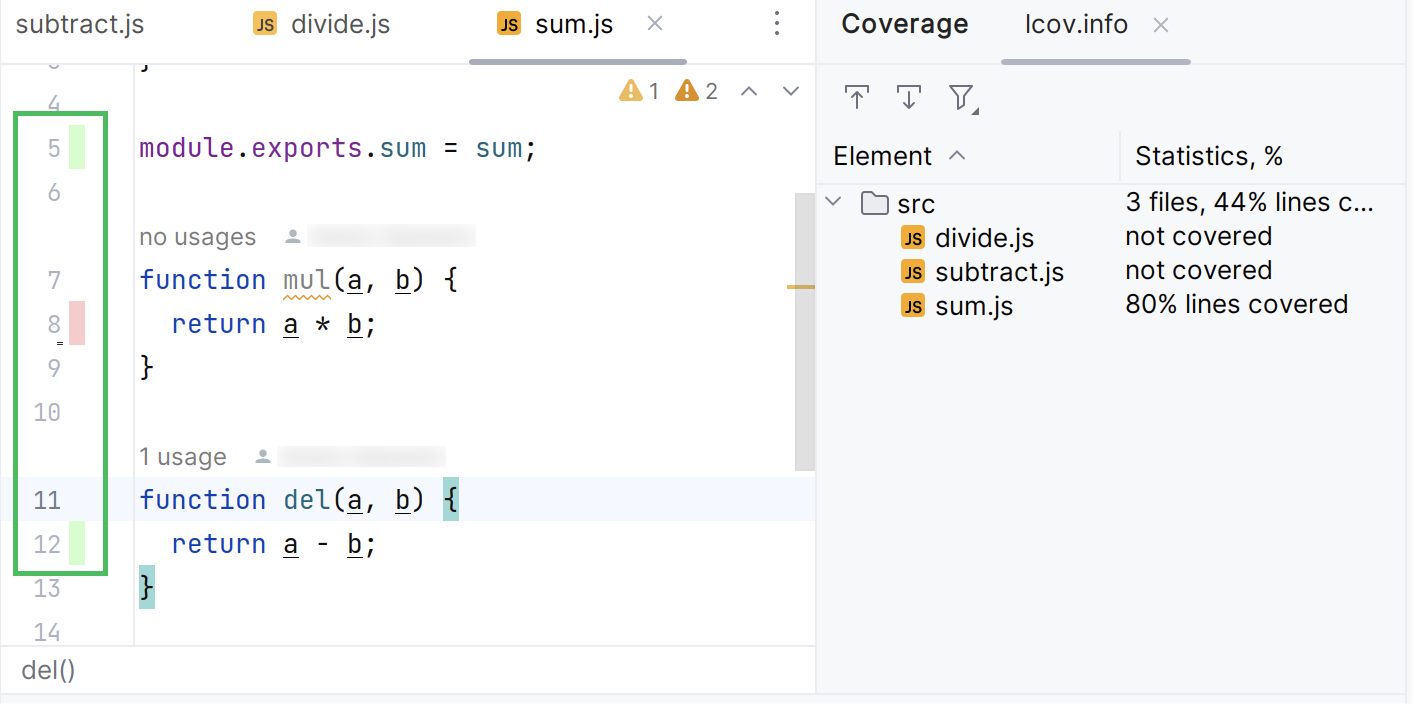
The report shows coverage for the lines that implement the logic of a method, function, or a class, but not for the function, method, or class declaration. The image below shows that code coverage is not applicable to line 7, while line 8 is not covered.
