Call Tree
Available for: sampling, tracing, line-by-line, and timeline snapshots
Call Tree shows method execution paths. Each method node in the tree represents a top-level method executed by a certain thread. The method node lists methods it called and metrics collected during profiling.
Use Call Tree to:
Get a quick overview of application activity: navigate through the most "expensive" calls or use the flame graph.
Examine the execution path of the slowest methods (the ones that consume most time or are called frequently) by:
inverting the tree to see who calls these methods
Apply filter by method to limit other filters with time intervals where only the method you are interested in was executed.
To help you perform thorough call stack analysis, Call Tree offers the following functionality:
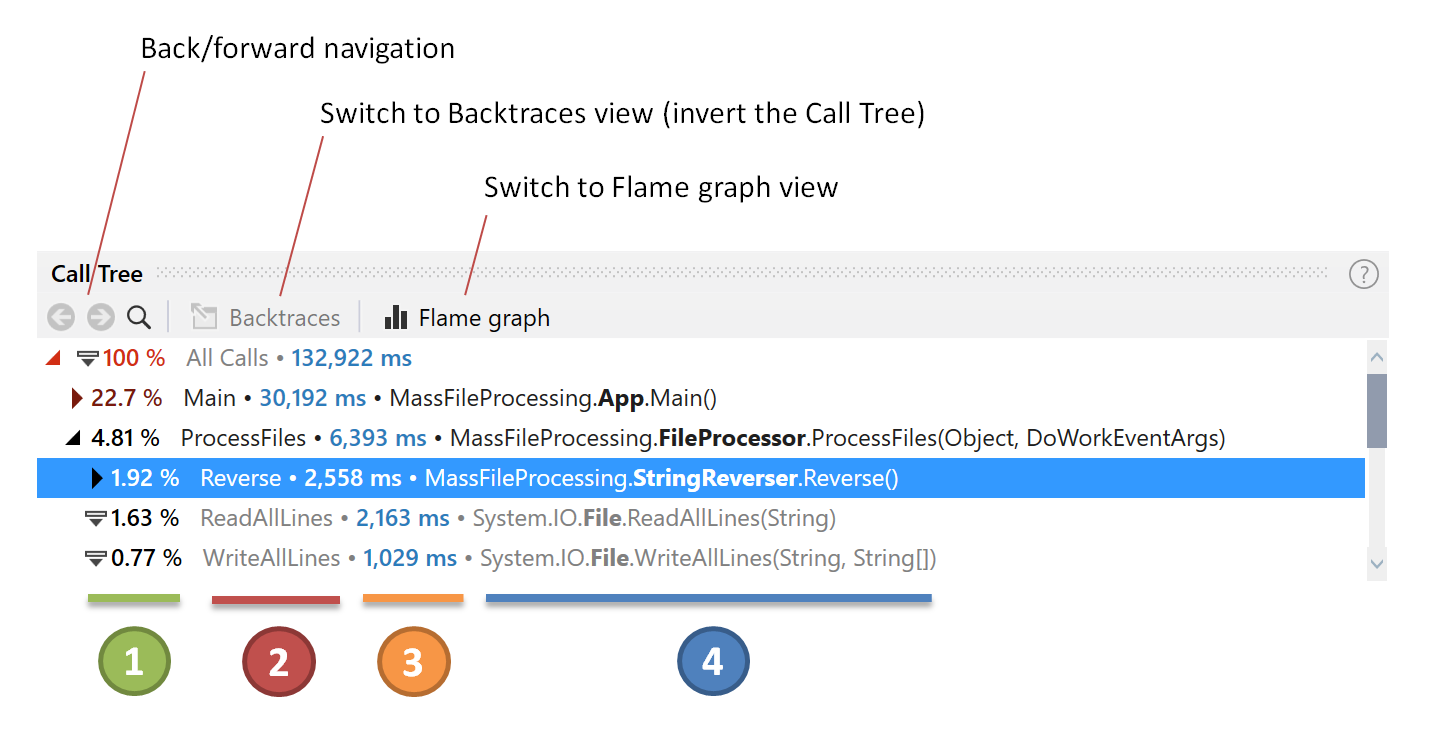
![]() The percentage of time spent inside a call relative to the total selected time.
The percentage of time spent inside a call relative to the total selected time.
![]() Short method name.
Short method name.
![]() Total time spent inside a call and its subtree. See the details below.
Total time spent inside a call and its subtree. See the details below.
![]() Full method name.
Full method name.
For better understanding how Call Tree calculates time, consider the example.
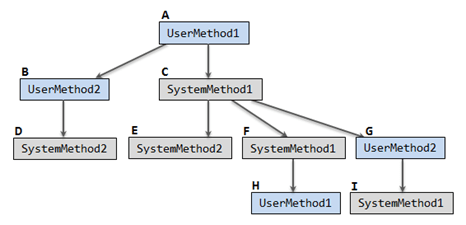
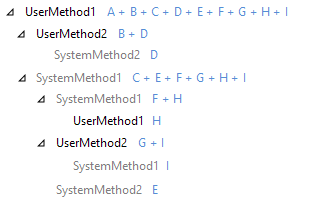
Call Tree will calculate time as follows:
The easiest way to go through all most "performance-expensive" methods in your application is use the Next Important Call action (Ctrl + Shift + Right). This action navigates you to the next call with a high own time. If such a call is not found in the current subtree, the action will navigate you to the next sibling of the currently selected node.
Select a method in Call Tree. This method will be your starting point.
Press Ctrl + Shift + Right or select Next Important Call in the context menu.
Repeat step 2 to go through all important calls in your application.
To simplify analysis of a certain execution path, you can limit the Call Tree scope to a particular method call.
Select a method in Call Tree.
Press Ctrl + Enter or select Scope to This in the context menu.
After you open a particular method call, it becomes a root node in Call Tree. All other calls except the subtree of the selected node are hidden. This also automatically applies a filter by the selected method occurrence. See details about filtering next in this section.

For instance, if in the example above you decide to scope to the UserMethod2 call (marked as B), Call Tree will look like and calculate time as follows:

If a method was called from a number of places, you can merge all method call occurrences within one page.
Select a method in Call Tree.
Press Ctrl + Shift + Enter or select the Merge Method Occurrences item from the context menu.
After this, the selected method becomes the root node in Call Tree containing all the occurrences. All other calls are hidden. This also automatically applies a filter by the method occurrences and their subtrees.

For instance, if in the example above you decide to see all UserMethod2 calls merged, Call Tree will look like and calculate time as follows:

To return to the previous call tree root, click the ![]() Back button at the top.
Back button at the top.
When Call Tree is focused on a method occurrence, you can switch Call Tree to the Backtraces mode using the corresponding control at the top of Call Tree.
In the Backtraces mode, you can see which functions have called a particular function from the bottom up. In other words, Backtraces is the inverted Call Tree view.

For instance, if in the example above you decide to open the UserMethod2 call (marked as B), Call Tree will show you methods called by UserMethod2:

If you switch Call Tree to the Backtraces mode, it will show you the execution path that ended with calling UserMethod2 or, in other words, the upper part of the tree:

note
Available for: sampling, tracing, and line-by-line snapshots
To simplify analysis of multithreaded applications, group call stacks by threads. To do this, click Group by Thread in the call tree.

Do one of the following:
From the main menu, select Edit | Find Function.
Press Ctrl+F.
Start typing. As you type, the lookup list narrows down, suggesting names that match the entered string. Note that you can use the CamelCase notation. It is case-insensitive, so there is no difference between 'gfnames' and 'GFNames'.

Select a class or a method from the list and press Enter.
The found method becomes a root node containing call subtrees of all its occurrences. This also applies a filter by method occurrences and their subtrees.
When navigating a call tree, there is always a problem with understanding how you got to a particular call. You can make the navigation easier by enabling the ![]() Show current call tree filtration path mode. In this mode, all your transitions are shown in the gutter of Call Tree, so that it is always clear where in the tree the focused node is.
Show current call tree filtration path mode. In this mode, all your transitions are shown in the gutter of Call Tree, so that it is always clear where in the tree the focused node is.

For instance, if in the example above you decide to open the UserMethod2 call (marked as G), normally, it will be shown as:

If you enable the ![]() Show current call tree filtration path mode, Call Tree will also show you the entire navigation path:
Show current call tree filtration path mode, Call Tree will also show you the entire navigation path:

This works with merged call instances as well. For instance, if instead of focusing on a particular UserMethod2 instance, you open all method instances merged, the Call Tree will look as follows:
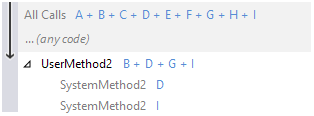
Note how different parts of the tree are represented with a single ... (any code) node.
When you scope to a particular method occurrence or merged method occurrences, Call Tree works as a filter by method occurrence(s).
After the filter is applied, other filters will show data only for the time intervals where the selected method occurrence(s) (including subtree) was executed.
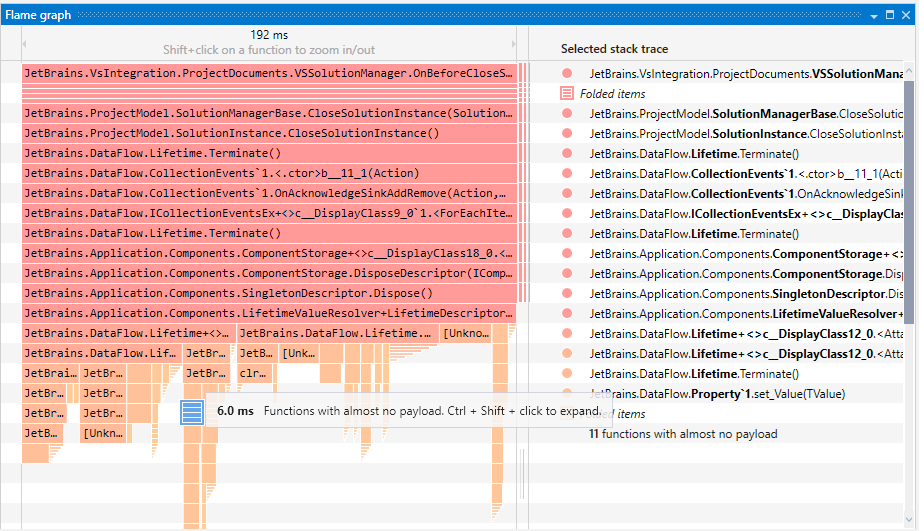
The flame graph is a graphical representation of the Call Tree. Each call is shown as a horizontal bar whose length depends on the call's total time, which equals the function's own time + the time of all its child functions. The longer the call, the longer the bar. To open the graph, click Flame graph in the Call Tree. This will build the graph for the current tree.
