Bun

Go to . Alternatively, select Edit Configurations from the Run widget on the toolbar.

In the Edit Configurations dialog that opens, click the Add button (
 ) on the toolbar and select Bun from the list.
The Run/Debug Configuration: Bun dialog opens.
In the File field, specify the path to the main file of the application that starts it. This can be a JavaScript or a TypeScript file.
Optionally:
In the Bun parameters field, specify Bun CLI options, for example,
--watchor--hot, learn more from the Bun official website.Select the Stop on Entry checkbox to have the application execution stop at the first line.
Set the breakpoints in the code where necessary.
Create a Bun run/debug configuration as described above.
From the Run widget list on the toolbar, select the newly created Bun configuration and click
 next to it.
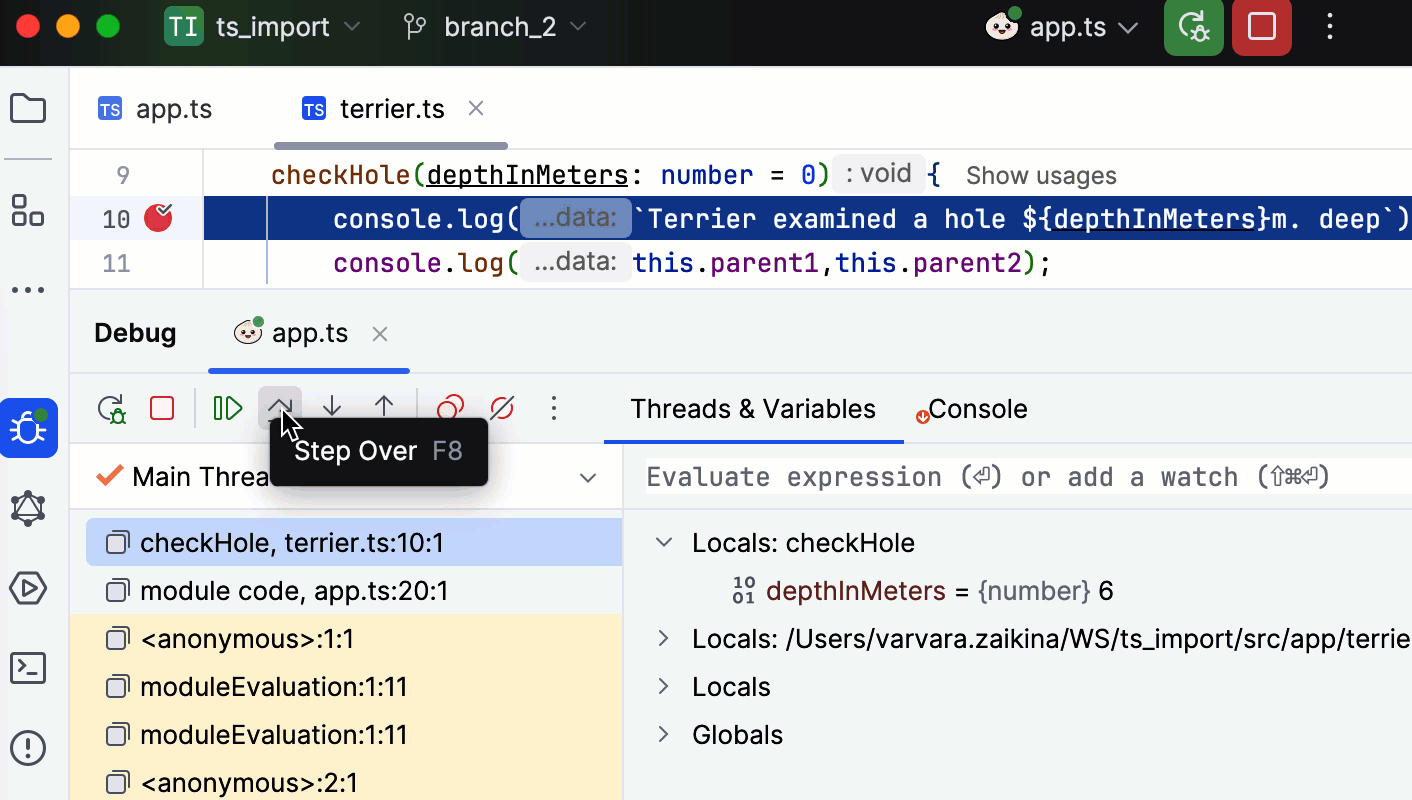
The Debug tool window opens.
Perform the steps that will trigger the execution of the code with breakpoints and switch to WebStorm, where the controls of the Debug tool window are now enabled. Proceed with the debugging session — step through the breakpoints, switch between frames, change values on-the-fly, examine a suspended program, evaluate expressions, and set watches.
Thanks for your feedback!