Project Home Page
Last modified: 20 April 2023Projects tab > <Project name>
Each project has a dedicated page. This page contains the following tabs:
Overview — this tab lists all build configurations for a project
Statistics — this tab shows selected charts for the project build configurations.
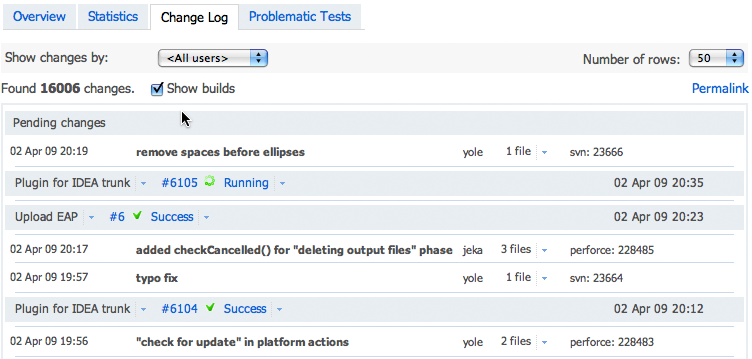
Change Log — this tab shows project-wide change log
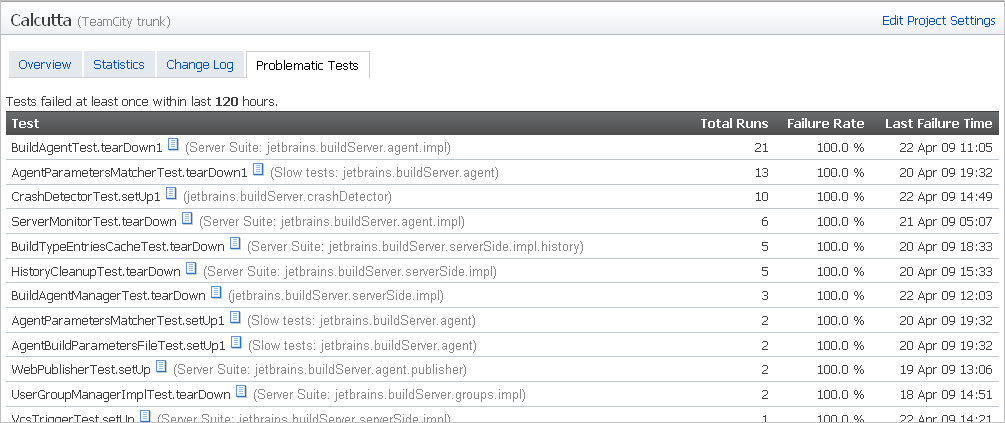
Problematic Tests — view all problematic tests in the project.
This page may also contain customArtifactBasedTab.
Overview Tab
Overview tab contains a table which represents a list of all the project build configurations. Format of the table is the same as in Projects page of the TeamCity web UI.
statisticsTabStatistics Tab
The charts show code coverage, duplicates and inspection results, and number of code lines if they are included in the project build configurations. Additionally, you can extend the statistics output with Custom Chart.
Chart Type | Description |
|---|---|
Code Coverage | This chart displays blue, green, dark cyan, and purple dots to track respectively the percentages of the classes blocks, lines and methods covered by the tests. |
Code Duplicates | This chart tracks the number of duplicates discovered in the code. |
Code Inspection | This chart displays red and yellow dots to track respectively the number of discovered errors and warnings. |
Configuring Pre-defined Statistics Charts
By default, Statistics tab shows charts for all build configurations in the current project, which have coverage, duplicates or inspections data. But this behavior may be configured on per-project level. You can disable charts of particular type at all, or specify build configurations to be used in the chart.
The configuration is done in <TeamCity data directory>/config/<project_name>/ plugin-settings.xml file, with some XML coding.
A similar format is used for all types of pre-defined graphs; only the name of top-level XML tag differs:
Chart Type | XML Tag Name |
|---|---|
Code Coverage | coverage-graph |
Code Duplicates (Java and .NET) | duplicates-graph |
Code Inspections | inspections-graph |
For example, consider code coverage charts configuration.
To disable all code coverage charts on the page, use the following syntax:
<coverage-graph enabled="false"/>
To show code coverage chart, which relates only to particular build configuration, use the following syntax:
<coverage-graph enabled="true"> <build-type id="bt234"/> <build-type id="bt236"/> </coverage-graph>
In the code example above, bt234 and bt236 values relate to build configuration identifiers.
note
Please note that denoted build configurations should contain code coverage data for charts to be shown. If the data are available, two charts will be shown (one for each specified build configuration).
The same syntax and principles apply to other pre-defined types of charts.
Configuring Custom Charts
See Custom Chart page for details of custom charts configuration.
customArtifactBasedTabCustom Artifact-based Tabs
It is possible to configure an artifact-based tab for the Project page; that is, the content of this tab will be provided using artifacts of a particular build. To configure such a tab, you need to add a corresponding section to < >/config/<project_name>/ plugin-settings.xml file:
<report-tabs> <report-tab buildTypeId="bt15" basePath="." startPage="coverage.txt" title="Coverage summary" auxiliary-id="Coverage summary"> <revisionRule name="lastSuccessful" /> </report-tab> </report-tabs>
The report-tab tag is quite similar to the one described in Including Third-Party Reports in the Build Results but you have to specify the build, which artifacts will be shown on the tab the following way:
Specify
buildTypeIdattribute to thereport-tabtag and set it to build configuration id.Add optional
revisionRulechild tag to specify exact build within build configuration. Use the attributesnameandrevisionfrom the table below.Name
Revision
Description
lastSuccessful
The tab will show artifacts from the last successful build
lastFinished
The tab will show artifacts from the last finished build (this is default when the whole
revisionRuletag is omitted)lastPinned
The tab will show artifacts from the last pinned build
buildNumber
12345
The tab will show artifacts from the build with given build number
Change Log Tab
tip
This option is available since Calcutta 4.1 EAP (build 8725) Release Notes
This tab shows the list of pending changes and changes already included in the builds of the current project:

Option | Description |
|---|---|
Show changes by: | Select committer's username from this drop-down list to view all the changes committed by the user for the current project. |
Found <number> changes | The number of changes found for the project. |
Show builds | Select to view the builds' numbers and navigate to the Build Results Home page. |
Number of rows | Select the number of changes (rows) shown on the page. |
Permalink | Use this link to create bookmark in your browser for easy further navigation to the currently opened page. |
Drop-down list of changed files | View the list of changed files in the Changes tab tab of the Build Results Home page, view differences, and jump to the source code in the active IDE. The latter option is only available, if the plugin for this IDE is installed, and you are logged in to TeamCity from within this IDE |
Problematic Tests Tab
tip
Problematic Tests tab is available since Calcutta 4.1 EAP (build 8804) Release Notes
In this tab you can view the list of problematic tests for the whole project, all of its build configurations. To view Test Details Page, click ![]() icon next to the test name.
icon next to the test name.
