Debug multi-thread and async applications
Multithreaded applications are always harder to debug as you have to track multiple threads at a time. Moreover, multithreaded applications introduce new types of bugs and performance issues like uneven workload distribution, lock contention, serialized execution, and so on.
The illusion of a sequential flow you get from stepping in a debug session does not help while debugging a multithreaded app and can be misleading. When investigating issues that can be concurrency bugs, you should rely more on breakpoints rather than on sequential stepping. For example, conditional breakpoints can help you a lot if you want to focus on just one thread: use some unique property of your thread (for example, thread ID) to trigger the breakpoint; data breakpoints will break the execution when any thread changes a marked property of a specific object.
Use the following features to debug multithreaded and async applications:
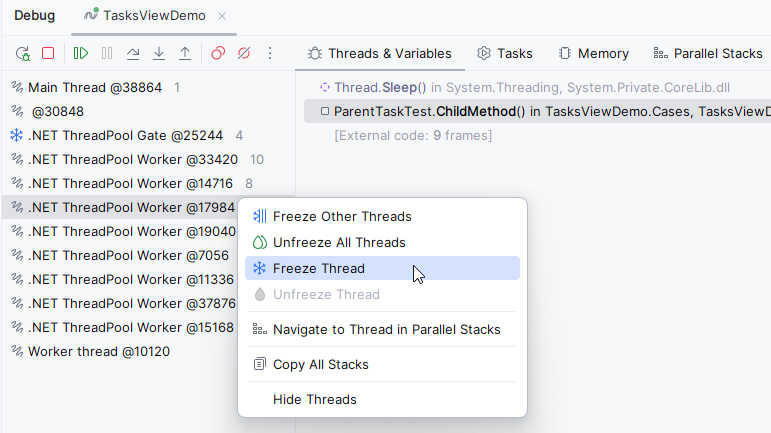
In the Threads & Variables tab of the Debug window, the left pane shows all threads of the application, and the next pane lists all stack frames of the selected thread:

The Parallel Stacks tab of the Debug window simplifies threads analysis by showing threads and their stack frames as a diagram.
The Tasks tab of the Debug window helps you get detailed information about the state of
System.Threading.Tasks.TaskandValueTaskobjects in the current execution point of the application.The ID of the current thread is shown in line with the current execution point in the editor.
Freeze and unfreeze threads
To control the order of threads execution, you can suspend (freeze) and resume (unfreeze) specific threads. This technique will help you investigate deadlocks, race conditions, and other concurrency issues.
Find threads that you want to freeze or unfreeze in one of the following views of the Debug window:
Two left columns (threads and frames) in the Threads & Variables tab
Parallel Stacks tab
Table or Graph view in the Tasks tab
Right-click the desired thread and choose Freeze Thread or Freeze Other Threads. Frozen threads will be displayed with the
 icon.
icon.To unfreeze, you can click a thread and choose Unfreeze Thread or click anywhere in the corresponding view and choose Unfreeze All Threads.
