Tasks view
To get detailed information about the state of System.Threading.Tasks.Task and ValueTask objects in the current execution point of the application , use the Tasks view.
As soon as your program is suspended, you can study tasks in the corresponding tab of the Debug window .
In the table view, you can see all tasks with their current states and other details.

To locate the source code of a specific task, right-click it and choose Navigate to Task's Initial Location or Navigate to Task's Current Location.
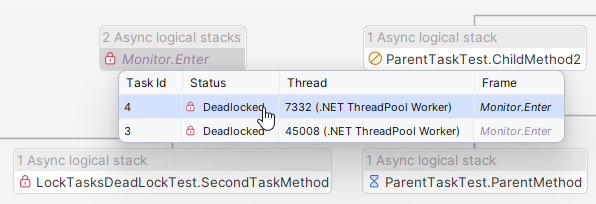
Use the selector in the top right corner to switch to the graph view:

To view the details of tasks in the graph, hover the mouse over the desired node:

For specific scenarios and use cases of the Tasks view, check out this blog post: How to use the Tasks View in JetBrains Rider.