Breakpoints
Breakpoints let you suspend the program execution at a specific statement and then analyze variables values, call stack, and other program parameters, evaluate expressions, as well as step through the program. In JetBrains Rider, you can work with the following types of breakpoints:
Line breakpoints, which you can set at a particular statement in your code. The debugger suspends program execution once the execution reaches this line. Line breakpoints can be set only on executable lines — comments, declarations, and empty lines are not valid locations for line breakpoints.
Exception breakpoints suspend the program when the specified exception is thrown. Unlike a line breakpoint, which requires specific source reference, an exception breakpoint applies globally.
Method breakpoints suspend the program each time it calls the specified method. Similarly to exception breakpoints, method breakpoints are not displayed in the editor, but only visible and configurable in the Breakpoints dialog (Ctrl+Shift+F8 or ) .
Data breakpointssuspend the program execution when a marked property of a specific object changes. Data breakpoints are helpful when you observe a change of value and want to figure out which code actually does the change.
You can set breakpoints before you start debugging your program and also when the program is already running under the debugger control (when it is in the debug mode). All breakpoints are saved and will not get lost after you restart JetBrains Rider.
To view all breakpoints in the current solution, use the Breakpoints dialog (Ctrl+Shift+F8 or ) . For each individual breakpoint in the list, you can view and change its properties as required.
Line breakpoints
Set a line breakpoint
Place the caret at the statement where you want to suspend the program execution and do one of the following:
Press Ctrl+F8.
In the main menu, go to Run | Toggle Breakpoint | Line Breakpoint.
Click the left gutter area at a line where you want to toggle a breakpoint. By default, the Show breakpoint preview on mouse hover option is enabled on the page of JetBrains Rider settings Ctrl+Alt+S, so you will see a preview icon when you hover over a line where it is allowed to set a breakpoint:

Initially, a breakpoint is represented with a filled red circle on the left gutter ![]() . The line of code where the breakpoint is set is highlighted. After you start debugging, a valid breakpoint is marked with the green check mark
. The line of code where the breakpoint is set is highlighted. After you start debugging, a valid breakpoint is marked with the green check mark ![]() and program execution will stop before this line of code is executed.
and program execution will stop before this line of code is executed.

You have an option to temporarily disable a breakpoint without actually removing it. Disabled breakpoints are shown as empty red circles ![]() .
.
Disable/enable a line breakpoint
While holding Alt, click the corresponding breakpoint icon the left gutter.
Click the breakpoint with the middle mouse button.
Right-click the breakpoint and clear the Enabled option.
In the Breakpoints dialog (Ctrl+Shift+F8 or ) , use the checkbox next to the breakpoint or the Enabled flag in the breakpoint properties.
Disable/enable all line breakpoints
In the Debug window, click Mute Breakpoints
. In the muted state, all breakpoints in the editor are shown in solid grey
.
Line breakpoint states
State | Icon | Description |
|---|---|---|
Enabled |
| Line breakpoint. Shown at design-time |
Conditional |
| Conditional line breakpoint. The breakpoint is hit only when a particular condition is satisfied. Shown at design-time. |
Disabled |
| A disabled breakpoint will not break the program execution. You may want to disable a breakpoint instead of removing it if you want to enable and use it in the future. |
Multiple |
| Several inline breakpoints are toggled in the line. |
Disabled by dependency |
| Dependent line breakpoint. A dependant breakpoint becomes enabled only after the breakpoint it depends on is hit. |
Tracepoint |
| If a breakpoint does not suspend the program execution (the Suspend flag is disabled in the breakpoint properties), it effectively becomes a tracepoint, which you can use to log the program state when the program reaches the code line marked by it. |
Valid |
| Shown at runtime when the breakpoint is recognized by the debugger as set on an executable code line. |
Invalid |
| Shown when the breakpoint is set on a non-executable line indicating that such breakpoint would not be hit. A breakpoint can become invalid, for example, if you do not have correct PDB files for the debugged program. |
Muted | Shown when all breakpoints are temporarily disabled (muted). You can mute/unmute breakpoints by clicking Mute Breakpoints |
Remove a line breakpoint
In the editor, locate the line with the line breakpoint to be removed, and click its icon in the left gutter.
Place the caret at the desired line and press Ctrl+F8.
In the Breakpoints dialog (Ctrl+Shift+F8 or ) , select the desired breakpoint and click Remove
.
After removing a breakpoint, you can toggle it again by pressing Ctrl+F8 or clicking the gutter area. However, if you have configured the breakpoint in some way, for example, by specifying a condition, you may want to restore the previous state of the breakpoint rather than toggling a new one.
Restore removed breakpoint
Select from the main menu.
By default, the action for restoring a breakpoint does not have a shortcut, but if you use it often enough, you can assign a custom shortcut to this action.
If you need a breakpoint that works just once, you can either set a temporary breakpoint with the dedicated command or make any line, method, or exception breakpoint temporary. When hit, such breakpoints are immediately removed.
Set a temporary line breakpoint
Place the caret at the statement where you want to suspend execution.
Do one of the following:
Press Ctrl+Alt+Shift+F8.
In the main menu, go to Run | Toggle Breakpoint | Temporary Line Breakpoint.
Alternatively, select the desired breakpoint in the Breakpoints dialog (Ctrl+Shift+F8 or ) , select the desired line breakpoint, and use the Remove once hit flag in the breakpoint properties.
Inline breakpoints in multi-statement lines
If a line contains several statements, you can toggle breakpoints for each statement separately.
Toggle an inline breakpoint
Set the caret inside the statement that you want to mark and press Ctrl+F8.
Click the gutter area next to the corresponding line. Depending on how statements are arranged in the line, the IDE will toggle a breakpoint either for the nesting statement or for the first independent statement in the line.
All other statements in that line will be displayed with breakpoint adornments that you can click to toggle breakpoints as desired:

When the debugger suspends program execution at an inline breakpoint, the corresponding statement is highlighted:

If you have toggled several inline breakpoints in one line, the gutter will display a multiple breakpoint icon ![]() for that line. If you click this icon, all breakpoints in the line will be removed.
for that line. If you click this icon, all breakpoints in the line will be removed.
Conditional line breakpoints
The debugger allows you to set a condition, under which a particular breakpoint will be hit. This may be helpful, for example, if you want to see how your program behaves when a variable takes a certain value.
Set a condition for a line breakpoint
Do one of the following:
Right-click the corresponding breakpoint icon in the left gutter.
In the Breakpoints dialog (Ctrl+Shift+F8 or ) , choose the desired line breakpoint and select the Condition flag.
Enter an expression that uses variables available in the context and evaluates to
trueorfalse. Press Shift+Enter to open the multiline editor.
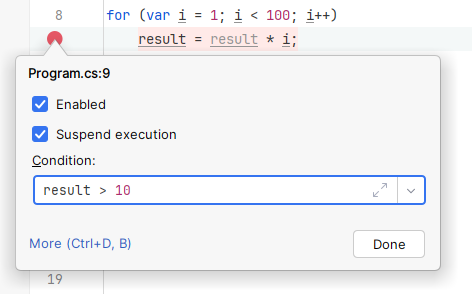
If the expression evaluates to true, the breakpoint is hit. For instance, in the example below, the breakpoint will be hit only if result > 10.
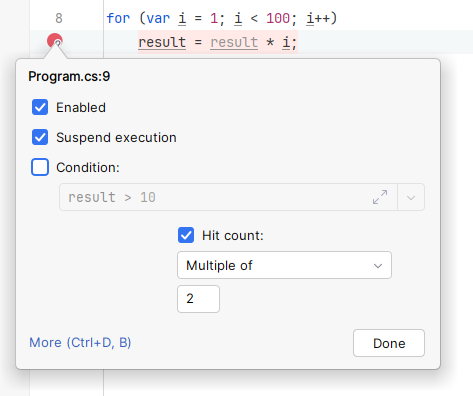
For simple conditions, when all you need is to trigger the breakpoint after a certain number of hits (for example, if a breakpoint is inside a loop), you can click More and configure the Hit count property. In the example below, the program will be suspended on each breakpoint hit which is a multiple of two, that is 2, 4, 6, 8, and so on.
Dependent breakpoints
In some complex debugging cases (for example, debugging a multi-thread application), suspending on a breakpoint may not make a lot of sense until some other breakpoint is hit. For this purpose, the debugger allows you to create dependent breakpoints.
Set a breakpoint the current one must depend on
Do one of the following:
Right-click the corresponding breakpoint icon in the left gutter and click More in the opened breakpoint properties.
In the Breakpoints dialog (Ctrl+Shift+F8 or ) , select the desired breakpoint.
In Disabled until selected breakpoint is hit, select a breakpoint the current one must depend on.
In After breakpoint was hit, select
Disable again to disable the current breakpoint after the selected breakpoint is hit.
Leave enabled to keep the current breakpoint enabled after the selected breakpoint is hit.
Tracepoints for logging program state
Sometimes, you may need to evaluate an expression at a specific execution point and log the result or log the fact that the breakpoint was reached. Typically, you do not need to suspend the program execution for each log entry.
For these purposes, JetBrains Rider allows you to turn any line, method, or exception breakpoint into a tracepoint. Tracepoint messages will be logged to the debug output (the Debug Output tab of the Debug window).
Log the program state at a tracepoint
Set a breakpoint Ctrl+F8 at the desired statement or choose one of the existing breakpoints.
Do one of the following:
Right-click the breakpoint and then click More in the breakpoint properties.
In the Breakpoints dialog (Ctrl+Shift+F8 or ) , select the desired breakpoint.
Clear the Suspend checkbox to make it a tracepoint. This is optional, of course. If you want both to stop at the breakpoint and to log its hit, leave the checkbox selected.
Choose how you want to log the breakpoint hit — a 'Breakpoint hit' message, the program's stack trace at this point, or both.
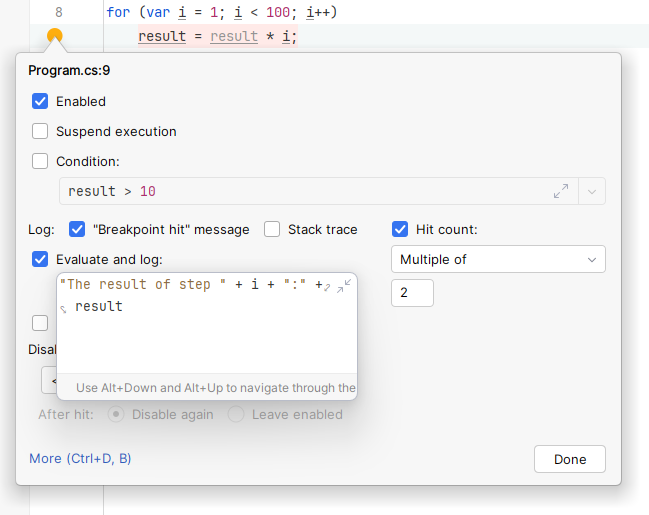
For line breakpoints you can also evaluate any expression and log its result — select Evaluate and log and enter the desired expression(s).
You can use any variables, classes, and their methods available in the scope. To add clarifying text to the output, use
String.Format()or string concatenation.If necessary, press Shift+Enter to open the multiline editor.
For example, an expression like this:
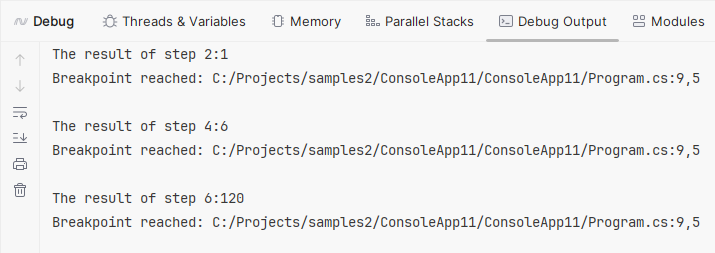
will print the following result to the Debug Output tab:
Labels for breakpoints
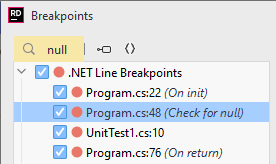
In the the Breakpoints dialog (Ctrl+Shift+F8 or ) , you can add names or short descriptions to breakpoints: right-click a breakpoint, choose from the context menu and then type the desired name/description.
You can use these labels to see the purpose of specific breakpoints and you can also start typing in the dialog to search labeled breakpoints:
Groups of breakpoints
In the Breakpoints dialog, you can organize breakpoints in a group, for example, to mark out breakpoints for a specific problem. When a group is created, you can move breakpoints into and out of the group and enable/disable all breakpoints in a group at once.
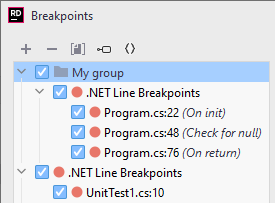
Create a group of breakpoints
Open the Breakpoints dialog (Ctrl+Shift+F8 or ) .
Select a breakpoint you are interested in. To select multiple breakpoints, hold the Ctrl key while selecting the breakpoints.
Right-click the selection and choose Move to group | Create new... from the context menu.
In the New Group dialog, type the name of the new group. The selected breakpoint moves to the newly created group.
Optionally, you can right-click a group of breakpoints and choose Set as default. After that, all newly created breakpoints will be automatically added to this group.
Optionally, you can select or clear the group checkbox to enable/disable all breakpoints within a group.
After a group is created you can move other breakpoints to that group by right-clicking and choosing Move to group in the context menu.
To move a breakpoint out of a group, right-click it and choose Move to group | [group name] or Move to group | <no group>. As soon as the last breakpoint is moved out of the group, the group is removed.
To remove a group together with all breakpoints in it, click Remove when that group is selected.
Thread-specific breakpoints
Debugging multi-threaded applications can be challenging: whenever you continue execution, you may be on another thread the next time a breakpoint is hit. To focus on debugging a specific thread, you can make any breakpoint thread-specific.
By default, any breakpoint will suspend program execution independently of the thread that hits it.
Make a breakpoint thread-specific
Start a debugging session so that the debugger can collect the program threads.
Right-click the breakpoint or find it in the Breakpoints dialog dialog Ctrl+Shift+F8.
Select Suspend only on specific thread and then choose one of the program threads:

Method breakpoints
A method breakpoint will suspend the program each time it calls the specified method. Similarly to exception breakpoints, method breakpoints are not displayed in the editor, but only visible and configurable in the Breakpoints dialog (Ctrl+Shift+F8 or ) .
Add a method breakpoint
Open the Breakpoints dialog (Ctrl+Shift+F8 or ) .
Click
and select Method Breakpoints.
In the dialog that opens, specify a fully-qualified name of the type (
Namespace.TypeName) and the name of the method, and then click OK
Data breakpoints
A data breakpoint lets you suspend the program execution when a marked property of a specific object changes. Data breakpoints are helpful when you observe a change of value and want to figure out which code actually does the change.
Unlike other kinds of breakpoints, data breakpoints apply to objects in a specific debug session, so they are only available during the session in the Debug window Alt+5.
Use a data breakpoint
Start a debugging session and then break the program execution to examine the program state. If necessary, do some stepping until the desired object gets into the local scope.
Open the Debug window, switch to the Threads & Variables tab, find the desired object, and expand it to locate the field or the property whose value you want to watch.
Right-click the property and choose Set Data Breakpoint.
Resume the program execution F9.
As soon as the property marked with the breakpoint changes its value, debugger will break the program at the line that caused the change.
The following short video shows how to set and use a data breakpoint: