Plain List
warning
Performance Viewer is deprecated since dotTrace 2022.3 and will be removed in one of the future releases.
The Plain List view shows all functions reachable in the current tab.
Click the corresponding icon
![ThemedIcon.ModePlainView.Screen.[-].png ThemedIcon.ModePlainView.Screen.[-].png](https://resources.jetbrains.com.cn/help/img/dotnet/2024.3/ThemedIcon.ModePlainView.Screen.%5B-%5D.png) on the left panel.
on the left panel.
The view consists of two lists. The first one contains all functions from the call stack. The second list shows functions called by the function selected in the first list (one level deep).
The lists contain the following columns:
Name | Description |
|---|---|
Function name | Name of a function. |
Time, ms | Total time spent in a function and its subtree. This includes own function time and time spent in functions called from this function. |
Own Time, ms | Time spent in a function only. |
Own/Total | Own to total time ratio. |
Avg Time, ms | Average time spent in one call. Not available for the Sampling profiling type. |
Calls | Number of function calls. Not available for the Sampling profiling type. |
note
To view system functions in the list, select the System functions checkbox.
When you open a snapshot in the Plain List view, you can:
Look through the list of all functions called in your application during the profiling process.
Sort functions by Function Name, Time, Ave Time, Own Time and Calls. To do that, click the corresponding column name. By default, functions are sorted by time. That lets you quickly find functions that take the most time.
Group functions in different ways. You can group by class, namespace or assembly. That helps you focus on functions from a certain part of your application. Moreover, dotTrace calculates time, own time and number of calls for each grouping element, that helps you find out the impact of the particular class or module on application performance.
Choose whether to show or hide system functions.
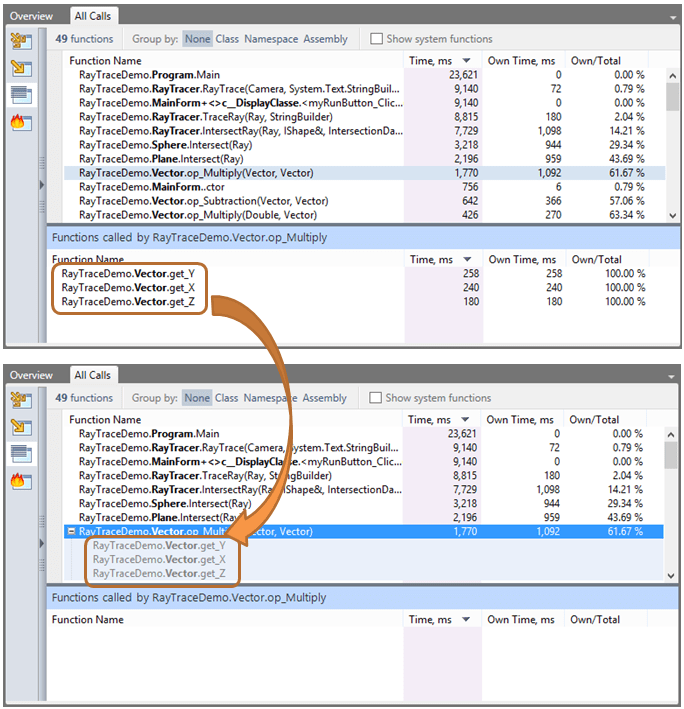
Collapse or extend callees for a particular function, i.e. show all call stacks starting with the selected function. This gives a summary of function execution.
Do one of the following:
From the menu bar, choose View | Group by | Class or View | Group by | Namespace or View | Group by | Assembly.
Click Class or Namespace, or Assembly on the view header.
Choose View | Group by | None from the menu bar or click None on the view header.
Select a function.
Do one of the following:
Right-click the function, and choose Collapse Callees or Uncollapse Callees.
Press Ctrl+Alt+Space.
The example below shows a function before and after collapsing callees.

Select the desired function.
Do one of the following:
Press Ctrl+C.
In the context menu, select Copy Signature to Clipboard.
From the main menu, select Edit | Copy Signature to Clipboard.