Log Highlighting
File | Settings | Editor | Log Highlighting for Windows and Linux
PhpStorm | Settings | Editor | Log Highlighting for macOS
CtrlAlt0S
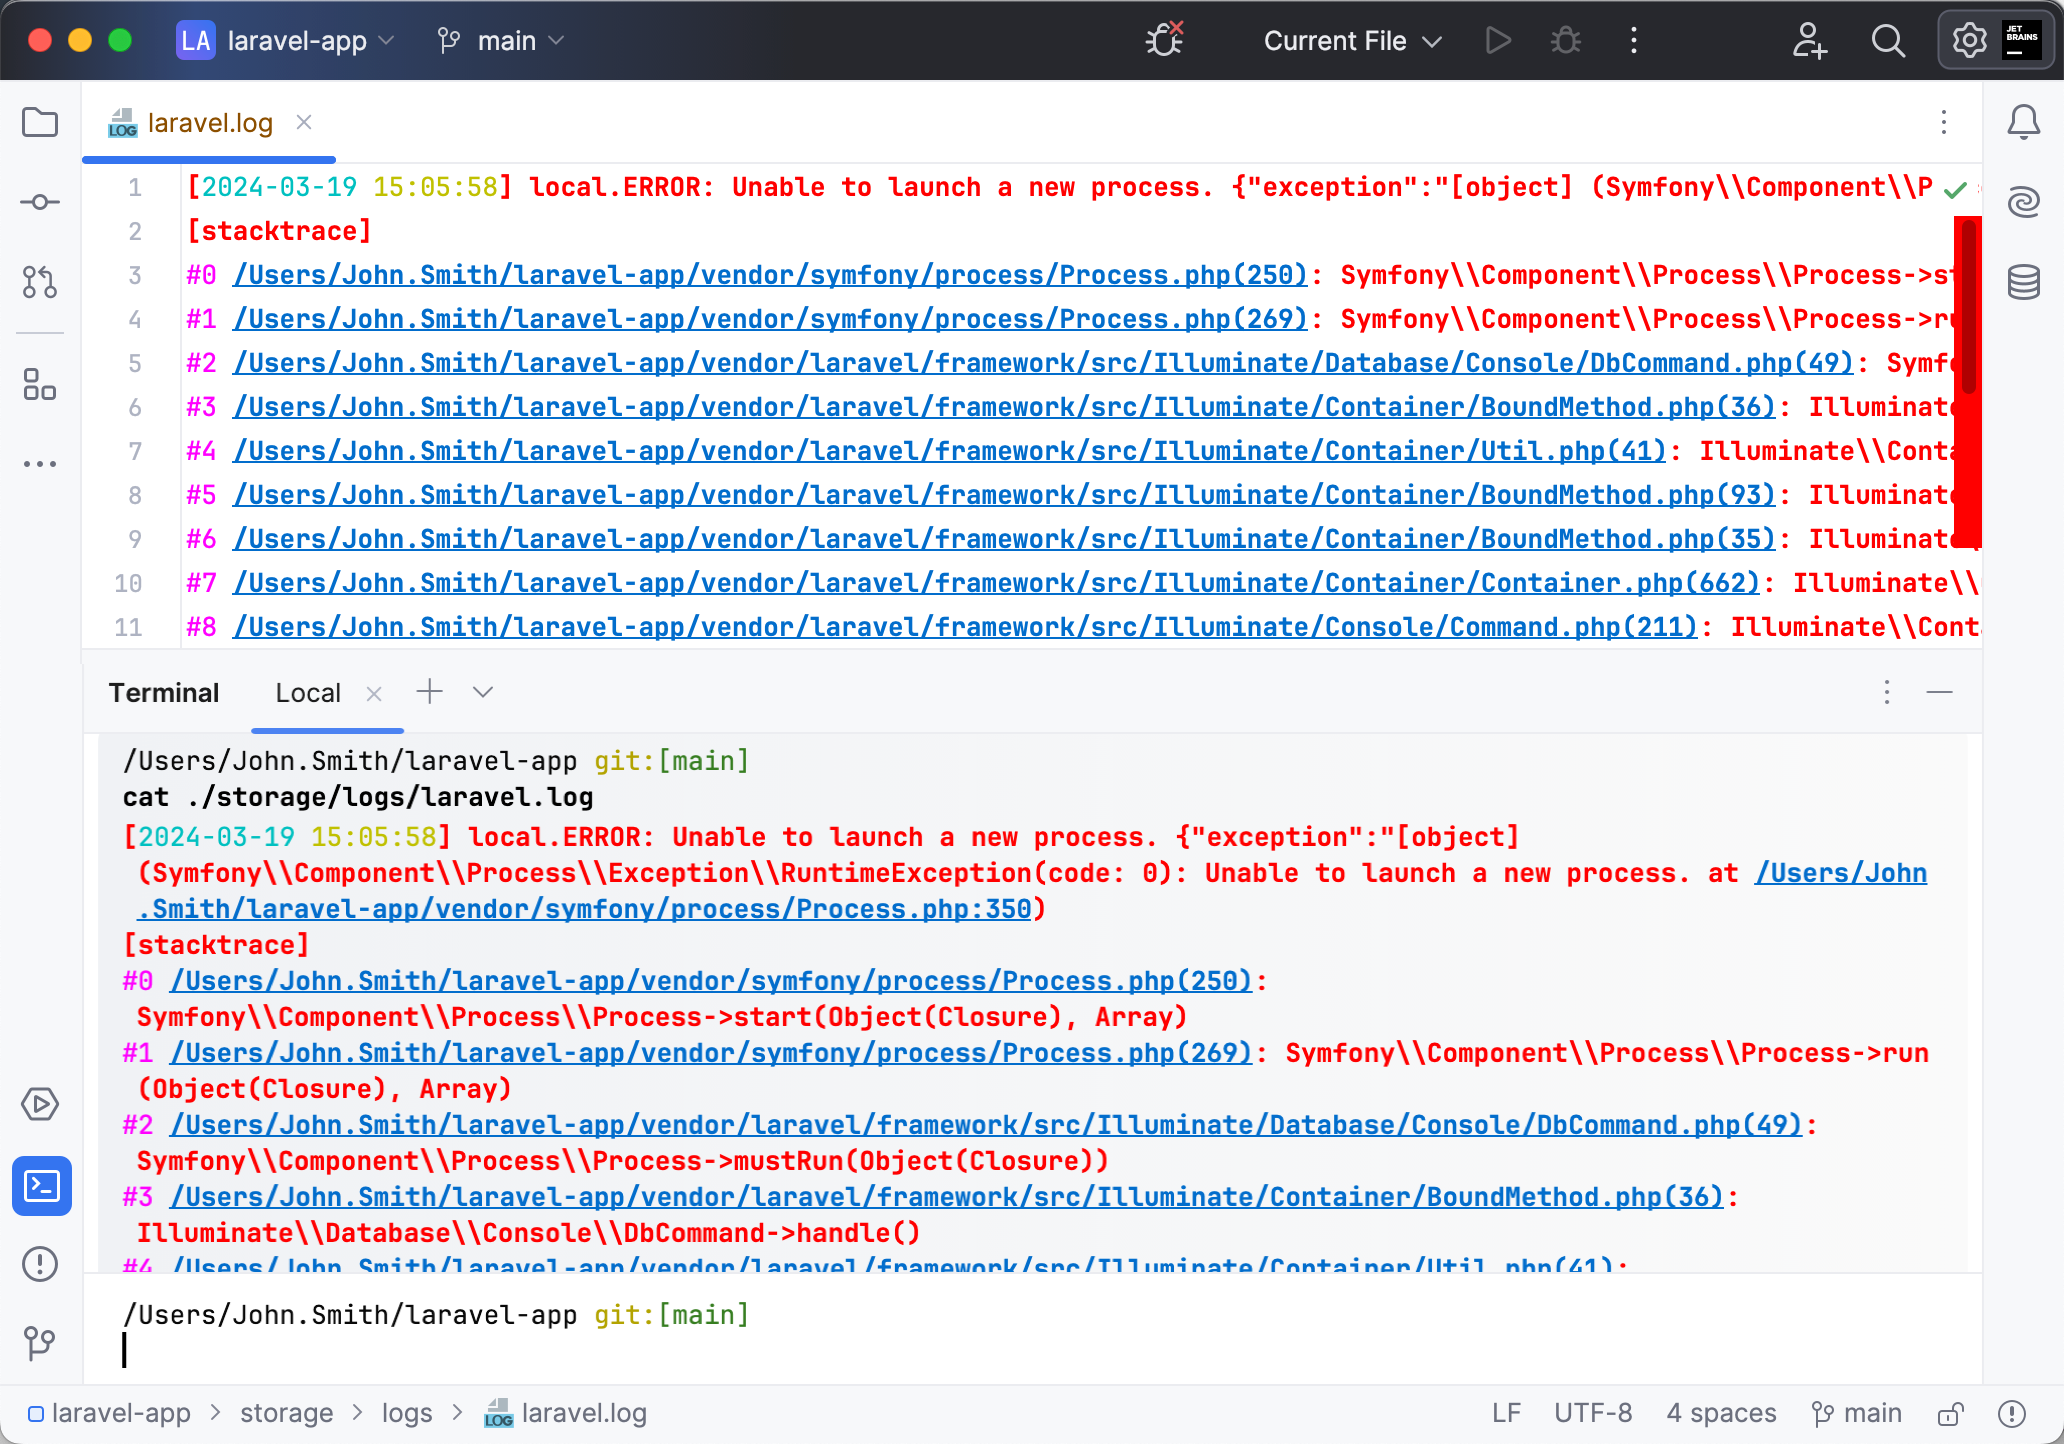
For better readability and navigation, PhpStorm highlights different elements of .log files that are opened in the IDE's editor or terminal.

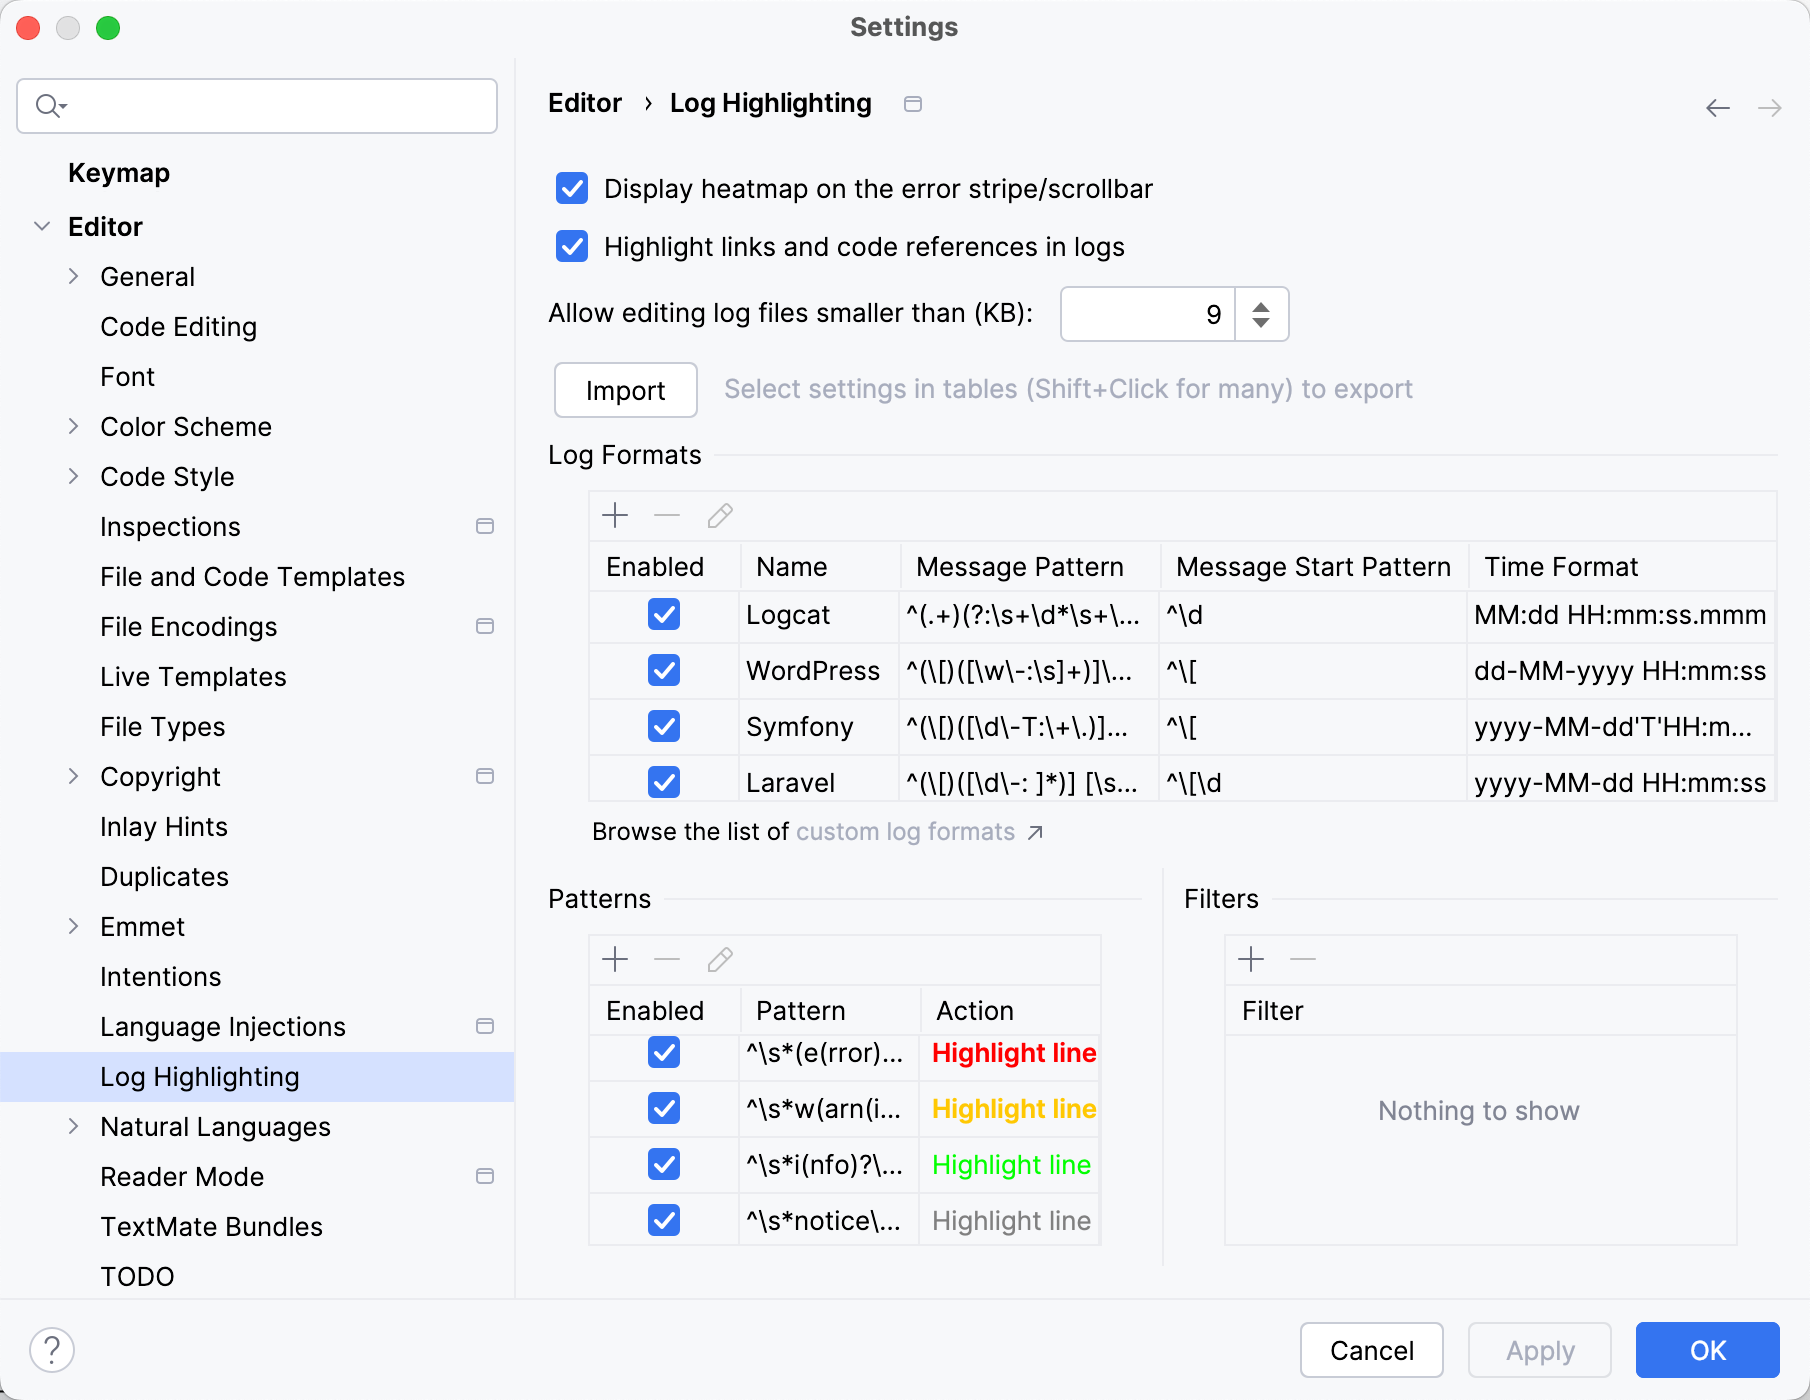
Log highlighting is based on the configurable log formats and coloring patterns. Highlighting of Laravel, Symfony, and WordPress log files is pre-configured and supported in PhpStorm by default. You can customize the pre-configured log formats and highlighting patterns, or add new ones in Settings CtrlAlt0S | Editor | Log Highlighting.
tip
The log highlighting functionality is implemented by means of the Ideolog plugin, which is bundled with your IDE and enabled by default. If you disable the plugin, the Log Highlighting page will no longer be available in the settings.

Item | Description |
|---|---|
Display heatmap on the scrollbar | Unselect the checkbox to disable log highlighting heatmap on the scrollbar. |
Highlight links and code references in logs | Unselect the checkbox to disable highlighting of links and code references in log files. |
Allow editing log files smaller than (KB) | Specify the minimum size of editable log files in KB.
|
Import | Click the button to import an existing |
Export | The button is displayed only after you select at least one item from the Log Formats, Message pattern, or Filters tables below. Click to export the selected log highlighting settings in the |
Reset Selection | The button is displayed only after you select at least one item from the Log Formats, Message pattern, or Filters tables below. Click to reset the selection. |
Log Formats | In this section, you can add custom log formats or edit/delete the pre-configured ones. To add a new log format, click
|
Patterns | In this section, you can add custom highlighting patterns or edit/delete the pre-configured ones. Highlighting patterns are applied to the capture groups specified in the Log Format section. Each highlighting pattern consists of a regular expression pattern and the coloring action which is applied if the text matches the pattern. To edit an existing pattern, select the respective row in the table and click
|
Thanks for your feedback!