Enhance performance
Last modified: 11 January 2023This article gives a summary of helpful techniques that you can use to improve AppCode performance on large-scale projects.
Increase memory heap
Enable memory indicator
To check whether performance slowdowns are caused by low heap memory, enable the memory indicator:
Right-click the status bar and select Memory Indicator.
The memory indicator will appear in the bottom right corner:

Increase memory heap
Select Help | Change Memory Settings from the main menu.
In the dialog that opens, set a higher memory heap value in the Maximum Heap Size field.
Click Save and Restart.
Increase memory heap from Toolbox
When you cannot access the Change Memory Settings dialog from the AppCode main menu, you still can change the memory heap size from Toolbox:
Select your AppCode version in Toolbox and click the screw nut button on the right.
From the menu that opens, select Settings.
Go to the Configuration section and set a new value in the Maximum heap size field:

Restart AppCode.
AppCode also warns you if the amount of the free heap memory is less than 5% of the maximum heap size:

Click Configure and enter a new heap size value in the dialog that opens.
In case AppCode is running out of memory when attempting to perform some operation, the Out of Memory dialog appears where you can set a higher value in the -Xmx field.
Speed up code analysis
Filter the list of inspections
On-the-fly code analysis is one of the most performance-consuming processes in AppCode. To lighten it up, shorten the list of inspections in Preferences | Editor | Inspections (see other ways of disabling and suppressing inspections).
You will always be able to run inspections on demand using the Code | Running Code Cleanup with profile ''{0}''… command and explore the results in a separate tool window without affecting the editor. Also, you can postpone code analysis (and on-the-fly refactoring) until commit by setting up the Before Commit options.
Tune analysis for a file
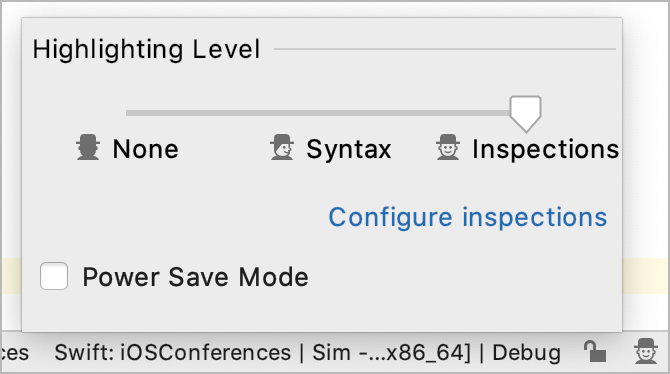
To change the level of code analysis for the currently opened file, click the Hector icon on the status bar or run Code | Analyze Code | Configure Current File Analysis Ctrl+Alt+Shift+H:

Move the slider to one of the available positions:
None: turn off the highlighting completely
Syntax: show syntax problems only
Inspections (default): show syntax problems and inspection issues
Speed up indexing
Exclude directories and file types
Your project may contain folders with binaries, logs, or build artifacts, which do not affect AppCode code insight. Also, indexing some folders can be too expensive due to their size or location. So it is reasonable to exclude such folders manually: in the Project tool window, switch to the Files view, right-click the folder you want to exclude, and select Mark Directory as | Excluded.
Since the symbols from the excluded files remain uncompleted for AppCode, the following features are not available for such files: code completion and auto-import, code generation, Find in Files (except for the scope of the currently opened files), navigation, and refactorings.
tip
If you are working in remote development mode, the directories you mark as excluded will not be synchronized with the remote machine. .
Another way to eliminate files like logs or generated data from indexing is to exclude them by file type in Preferences | Editor | File Types:

Download Xcode caches
Every time you update the Xcode version, AppCode needs the new Xcode caches. You can set up AppCode to download these caches automatically by selecting the Download Xcode caches automatically checkbox in Preferences | Tools | Xcode.
If this option is unchecked, the dialog where you can choose whether you want to download the caches will appear. If you opt for not downloading the caches, AppCode will have to build them on demand, which may significantly increase the indexing time.
Disable unnecessary plugins
To increase the IDE performance, try disabling the plugins you don't need. You will always be able to turn them on again later.
For example, if you are using a particular testing framework, consider disabling the plugins for other testing frameworks supported in AppCode.
Go to Preferences | Plugins.
Browse the Installed tab and disable the unnecessary plugins:

You can also disable all manually installed plugins at once (the non-bundled ones) from the menu under
:

Report performance problems
If you experience an IDE freeze or high CPU/memory usage, and the tips listed above do not help, please provide us with the IDE logs, thread dumps, and snapshots. See this instruction for details on how to retrieve and send them.
Thanks for your feedback!