UltimateKafka monitoring
Last modified: 01 August 2022The Big Data Tools plugin let you monitor your Kafka event streaming processes.
Typical workflow:
Create a connection to a Kafka server
In the Big Data Tools window, click
and select Kafka under the Monitoring section. The Big Data Tools Connection dialog opens.
The Big Data Tools Connection dialog opens.

Mandatory parameters:
URL: the path to the target server.
Name: the name of the connection to distinguish it between the other connections.
Optionally, you can set up:
Properties: the list of configurable connection parameters. See Kafka reference documentation for more details. You can specify a file with the properties or the properties will be retrieved from Kafka documentation. You start typing a property name and press Ctrl+Space to get a target property.
Enable tunneling. Creates an SSH tunnel to the remote host. It can be useful if the target server is in a private network but an SSH connection to the host in the network is available.
Select the checkbox and specify a configuration of an SSH connection (click ... to create a new SSH configuration).
Per project: select to enable these connection settings only for the current project. Deselect it if you want this connection to be visible in other projects.
Enable connection: deselect if you want to restrict using this connection. By default, the newly created connections are enabled.
Click the question mark next to the Kafka support is limited message to preview the list of the currently supported features.
Once you fill in the settings, click Test connection to ensure that all configuration parameters are correct. Then click OK.
At any time, you can open the connection settings in one of the following ways:
Go to the Tools | Big Data Tools Settings page of the IDE settings Ctrl+Alt+S.
Click
on the Kafka connection tool window toolbar.
Once you have established a connection to the Kafka server, the Kafka connection tool window appears.


The window consists of the several areas to monitor data for:
Topics: Categories divided on partitions to which Kafka records are stored.
Consumers: A view of all consumer groups for all topics in a cluster.
Adjust layout
In the list of the Kafka topics, select a target topic to preview.
On the right pane, select a partition to study in the Partitions tab.

Switch to the Configuration tab to review the config options.
To manage visibility of the monitoring areas, use the
buttons:

You can enable viewing internal topics. These topics are created by the application and are only used by that stream application. See more details in Kafka documentation.
When you enable the full config options in the Configuration tab, you can see the options that do not change their default values.
Once you have set up the layout of the monitoring window, opened or closed some preview areas, you can filter the monitoring data to preview particular job parameters.
Filter out the monitoring data
Click a column header to change the order of data in the column.
Click Show/Hide columns on the toolbar to select the columns to be shown in the table:

At any time, you can click on the Kafka connection tool window to manually refresh the monitoring data. Alternatively, you can configure the automatic update within a certain time interval in the list located next to the Refresh button. You can select 5, 10, or 30 seconds.
Produce and consume messages
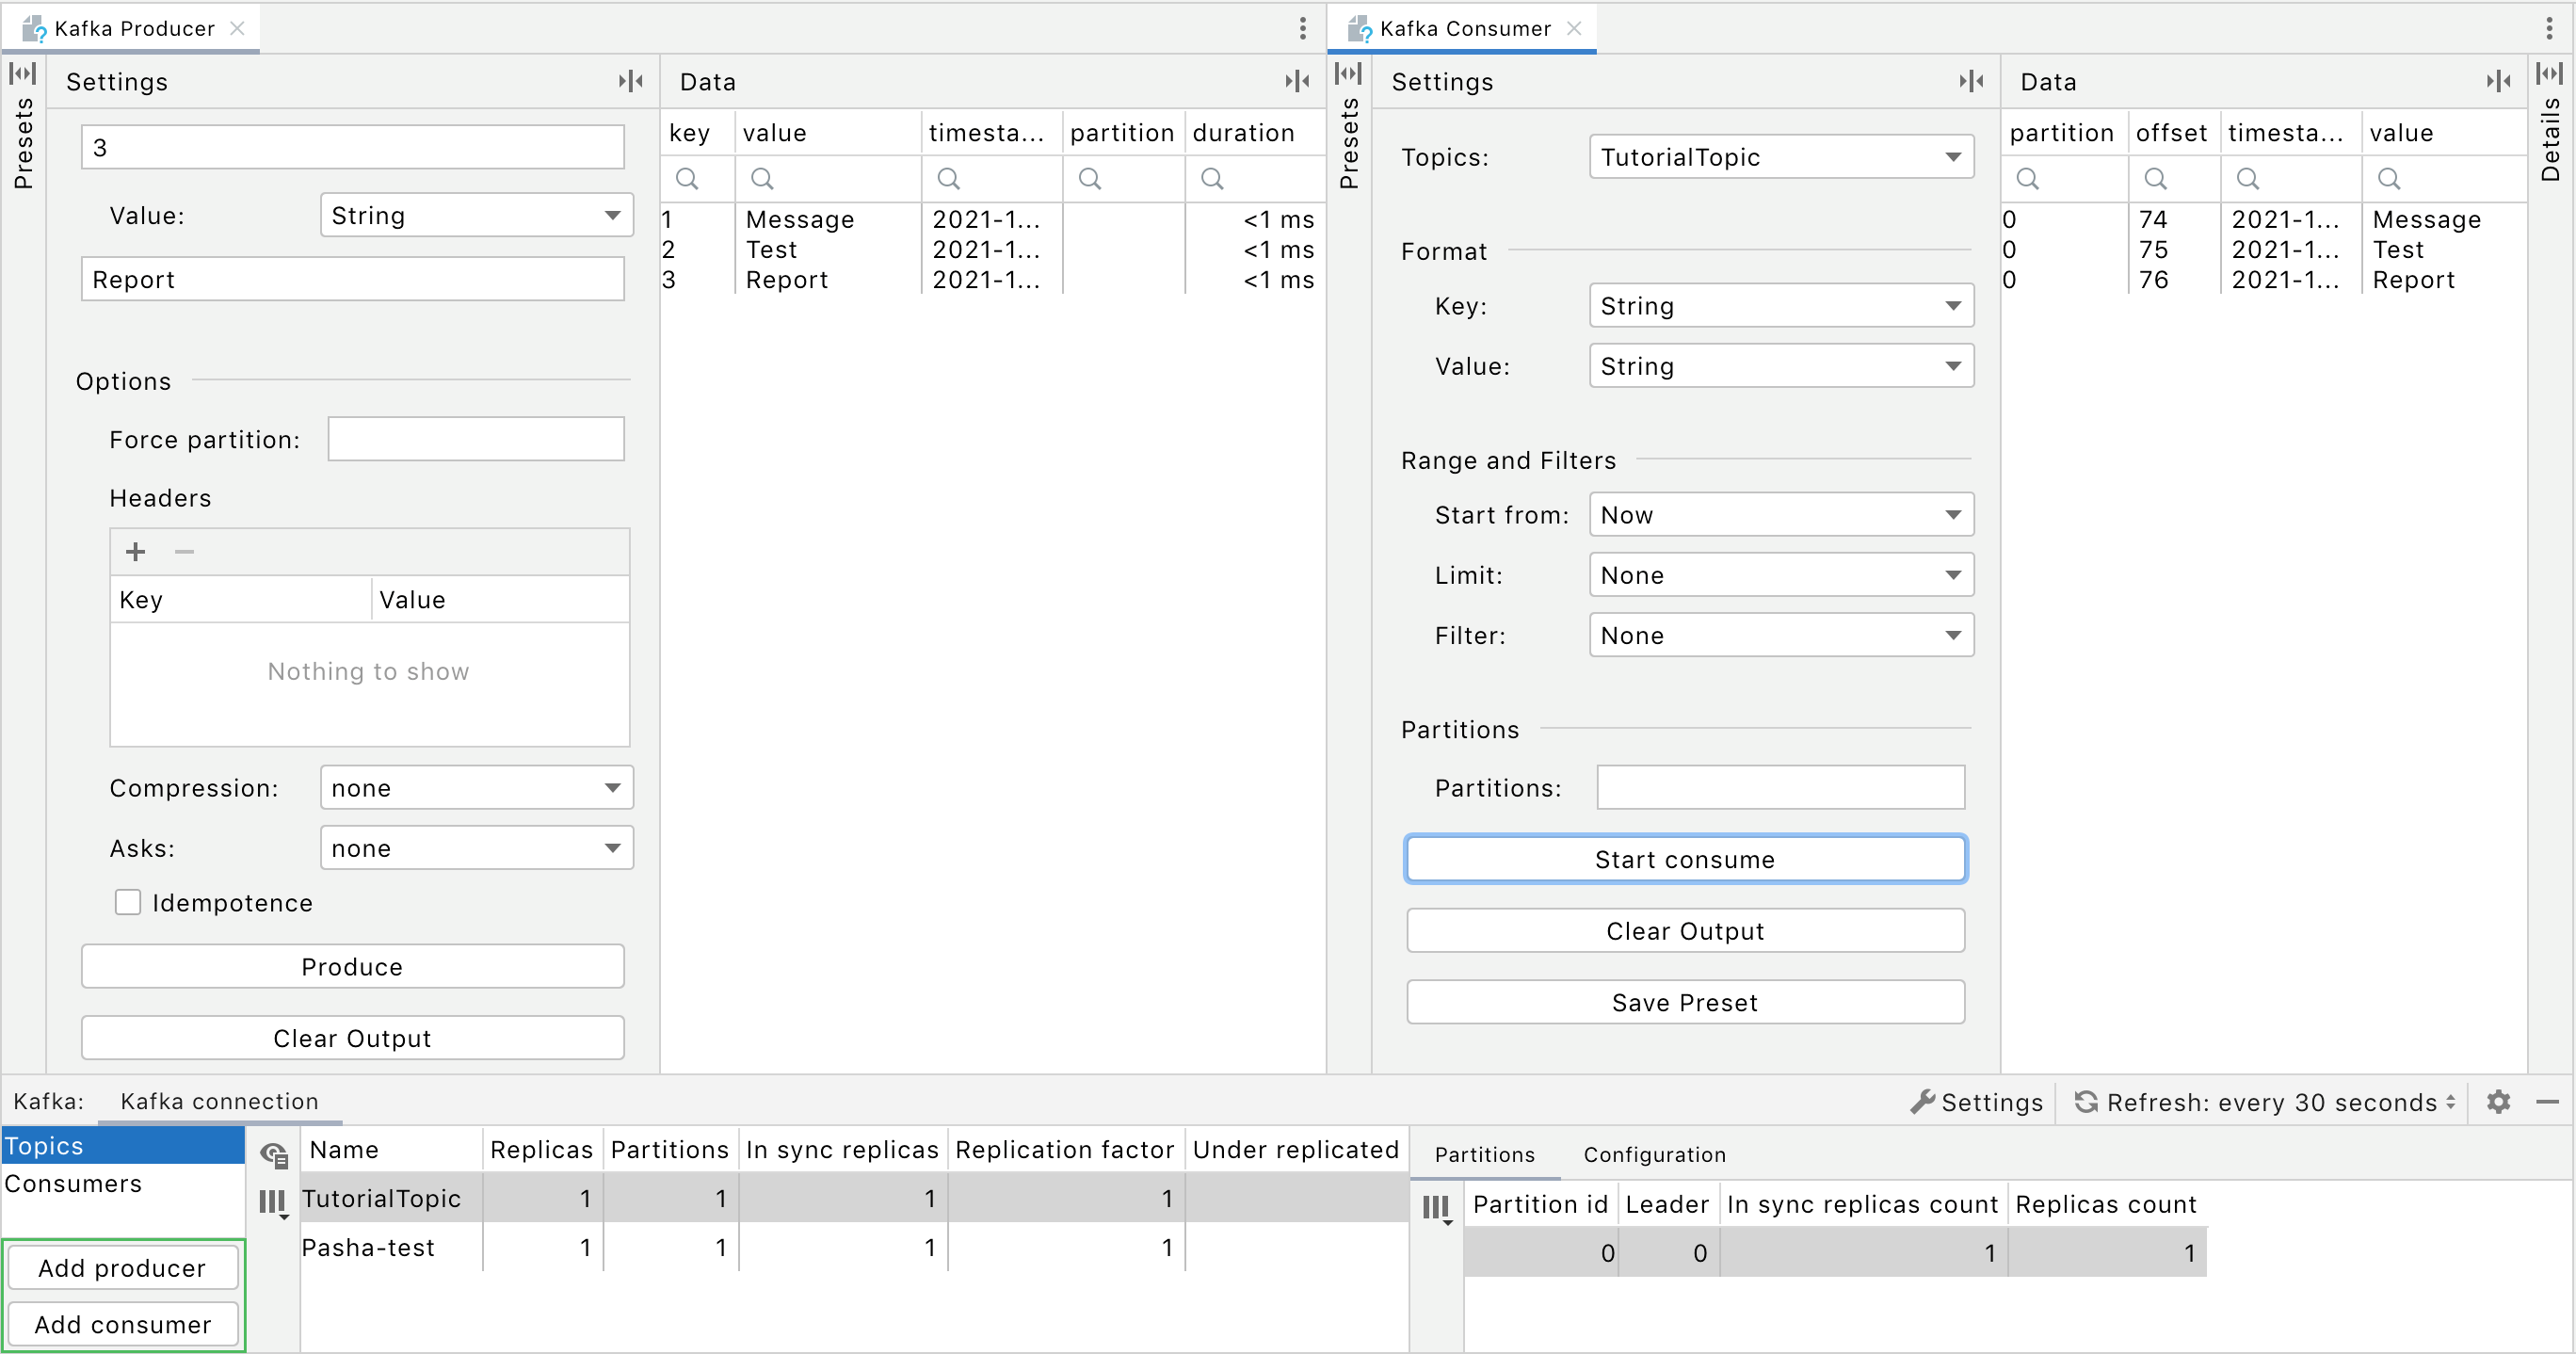
Mind the Add producer and Add consumer buttons in the Kafka monitoring tool window. With these controls, you can start generating and receiving data

Specify message parameters in the producer window and click Produce.
Click Start consuming in the consumer window to start receiving messages. To resume messaging, click Stop consuming. You can click Save Preset to create a specific set of the consumed messages. You can preview them later in the Presets pane of the consumer window.