Report performance issues
For certain diagnostic tools, the Performance Testing plugin is required.
To figure out what is causing a performance issue, you have to collect and submit certain troubleshooting materials to the JetBrains support team. The type of the troubleshooting material depends on the issue that you experience.
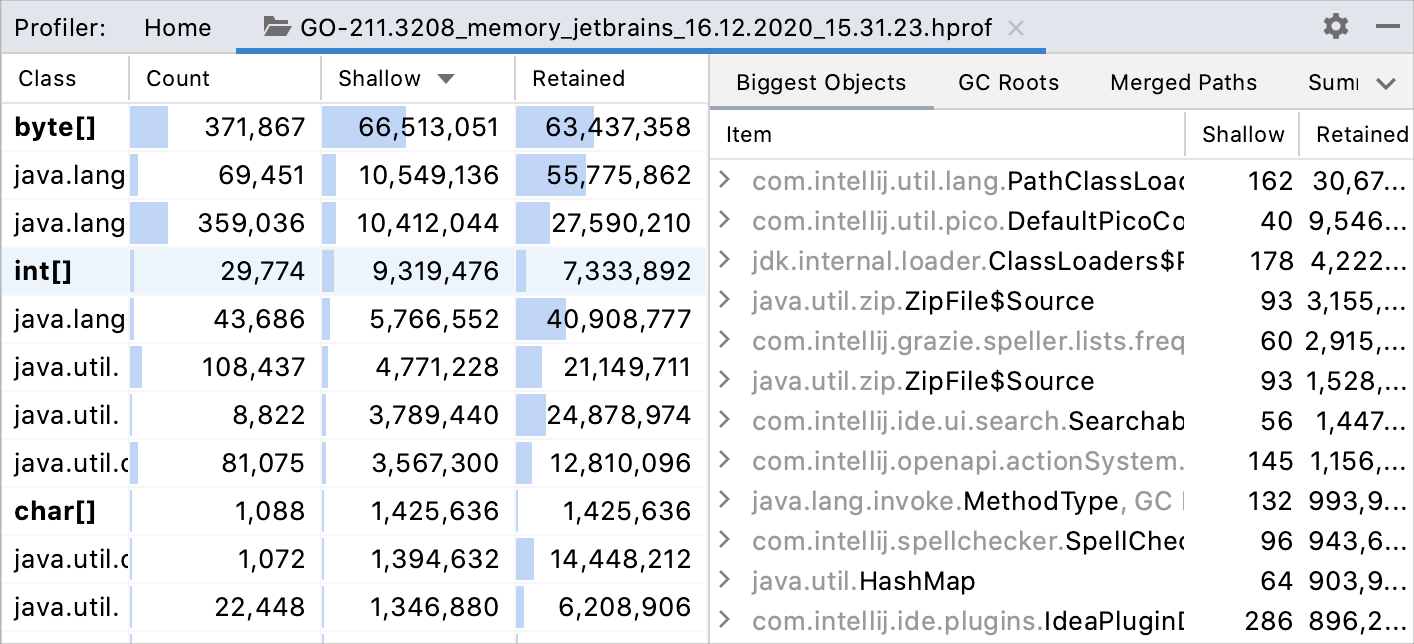
You can review the information that is included in the generated HPROF and SNAPSHOT files by using any Java profiler (for example, YourKit). To review HPROF files, you can also use the profiler of IntelliJ IDEA Ultimate (Run | Open Profiler Snapshot | Open).

The following situations might take place:
The IDE does not respond: the application hangs and does not respond to any action for a long time.
High CPU usage: the application is working but your performance monitoring utility shows that the application CPU usage is high.
High memory consumption or a memory leak: the application is working, but your performance monitoring utility shows that the application memory consumption is high.
Slow indexing: the indexing process became slower or cannot be finished.
Slow startup: the startup process takes a lot of time.
Slow or incorrect introspection: a retrieval of database objects is
If your snapshot is smaller than 10 MB, you can attach it directly to support tickets or YouTrack issues.
For files larger than 10 MB, use the JetBrains Uploads Service. After the upload is successful, share the Upload ID in the related support case or the Youtrack issue. For more information about getting help, refer to Support and assistance.
Consider archiving large or multiple files before uploading. If your upload speed is slow, split large archives into smaller parts.
To report an issue, you can use any option that is described in the Where to report an issue section. But we recommend using the JetBrains Support Center.
Click Help | Contact Support.
Fill in the Submit a request form.
If it is possible, attach some troubleshooting materials.
Click Submit.
Thanks for your feedback!