Support and assistance
Access online documentation from the IDE
The most important source of information about GoLand is this online help. To access it from GoLand, do one of the following:
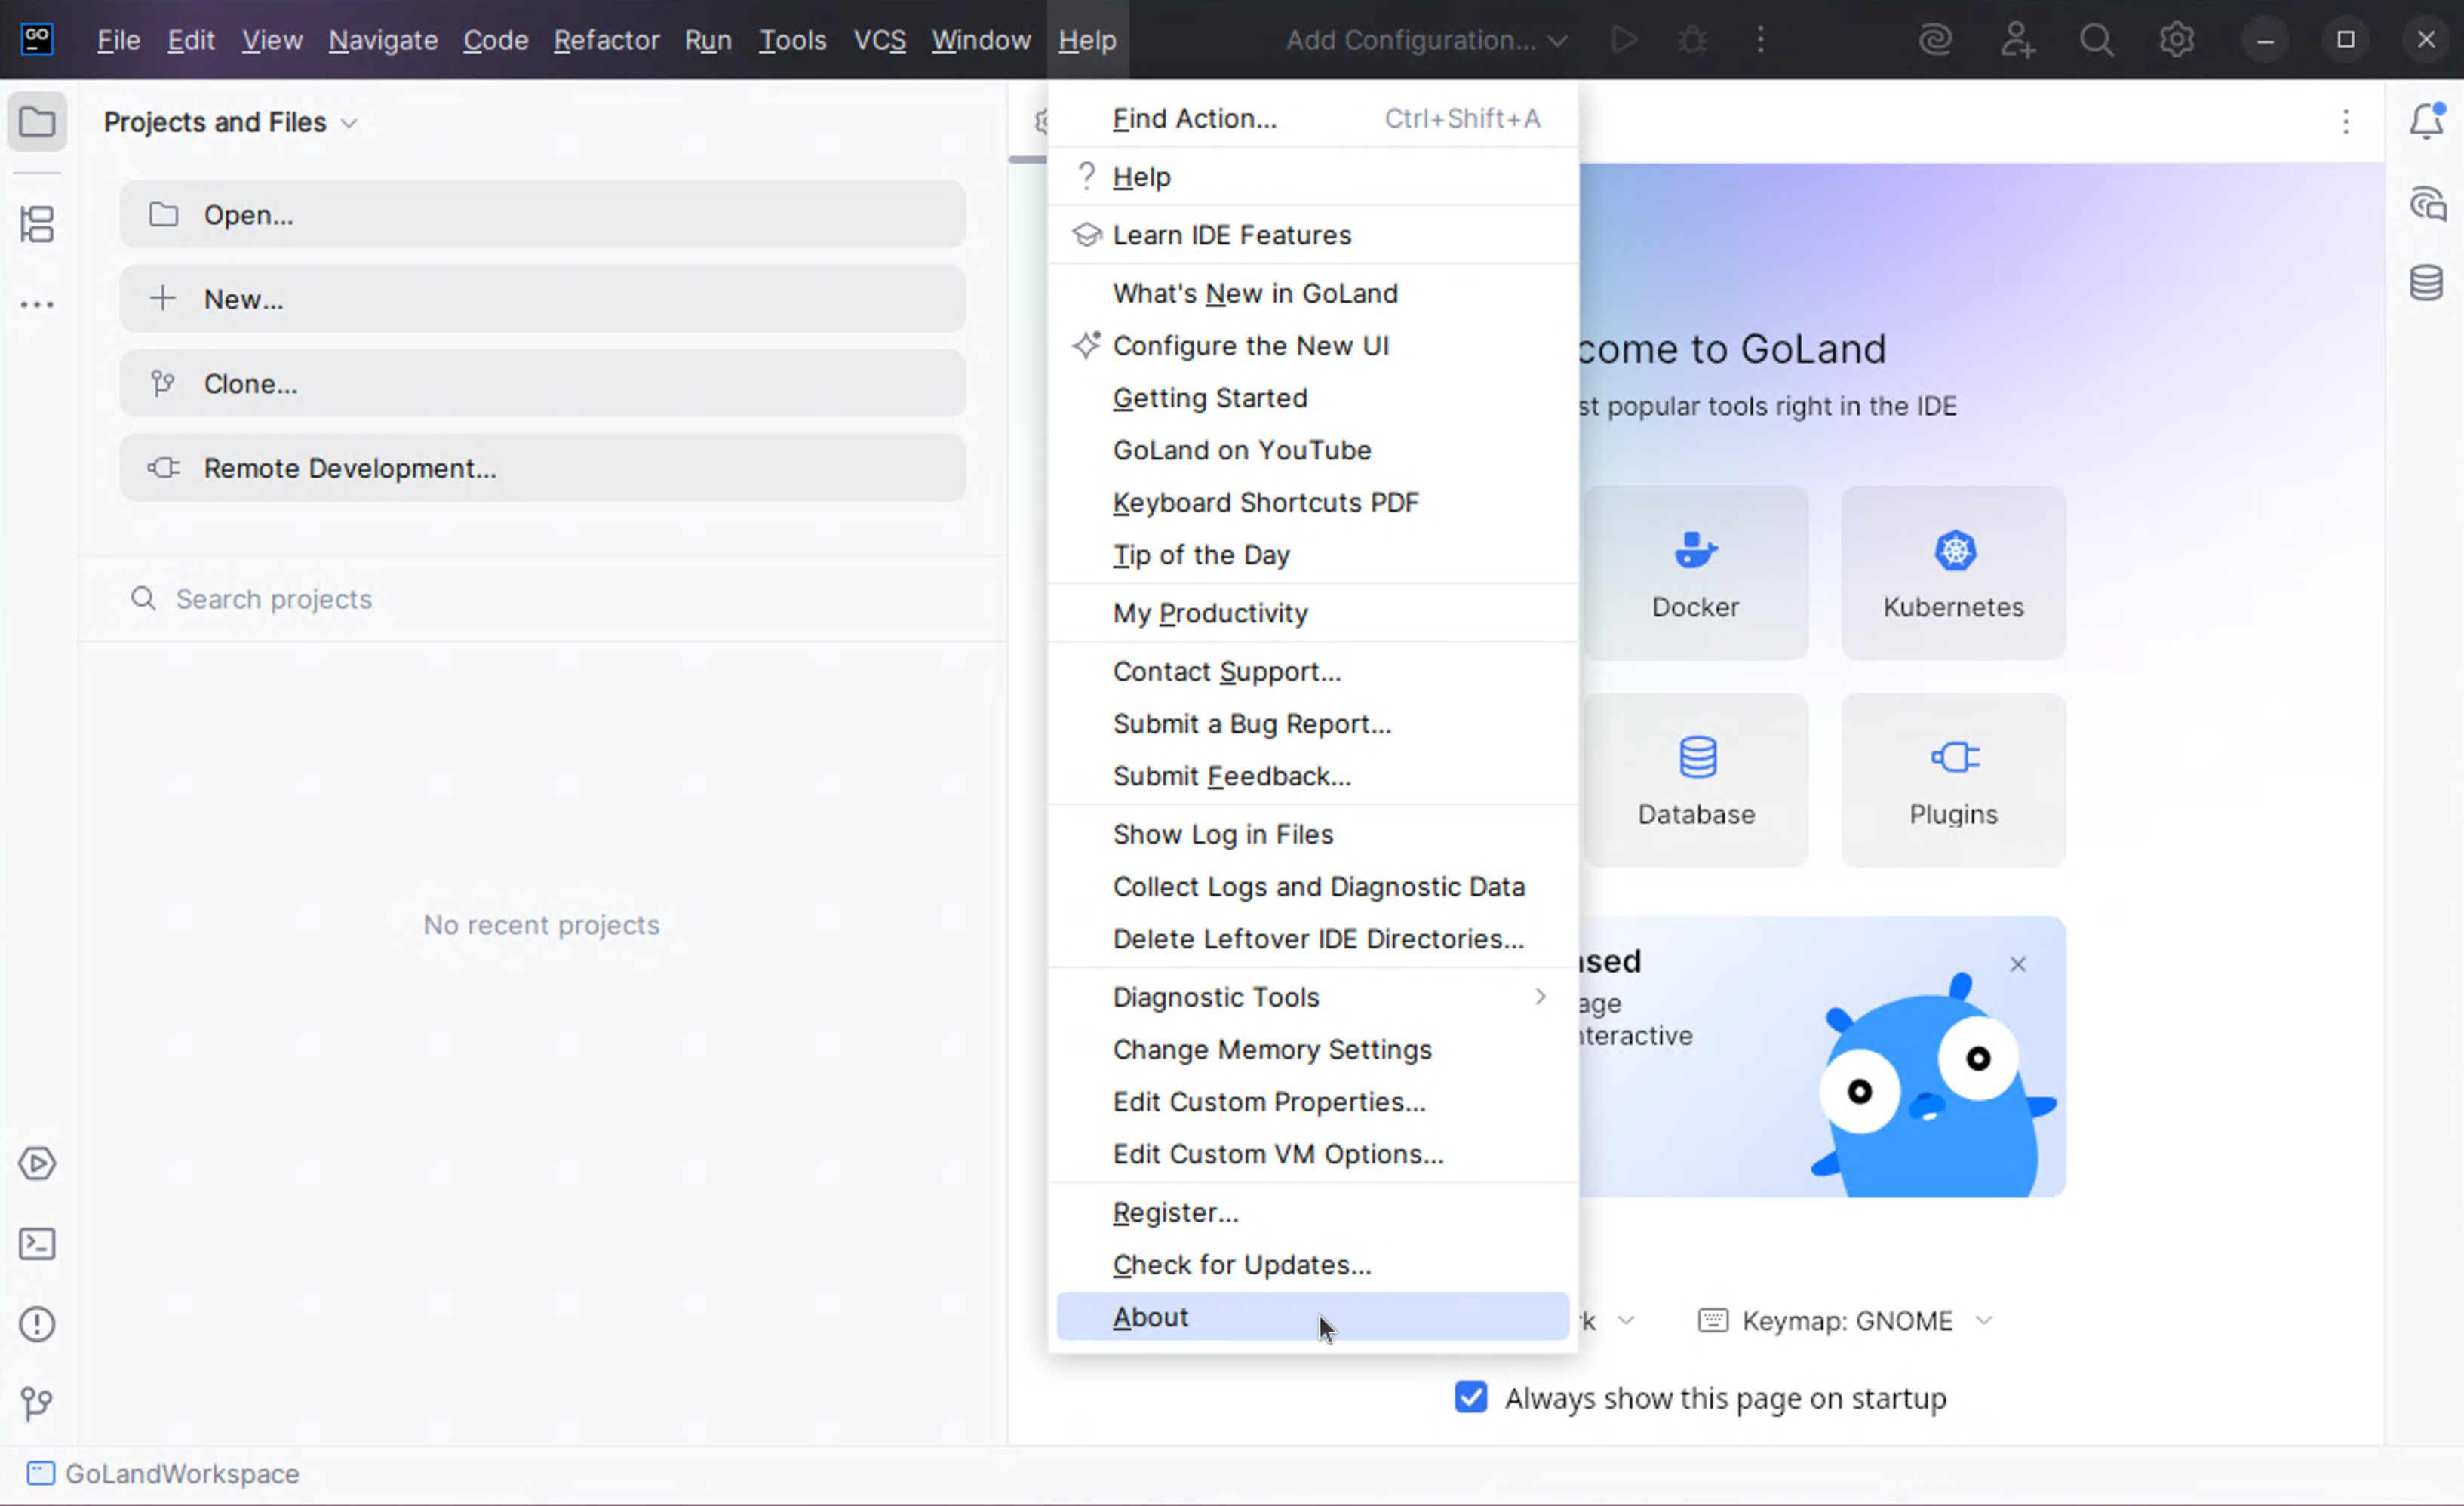
In the main menu, go to .
Press F1.
Click
in a dialog or a tool window.
Access documentation offline
If you do not have internet access to view the online help, you can use the GoLand Help plugin, which serves the help pages via the built-in web server for offline use.
Ask AI Assistant
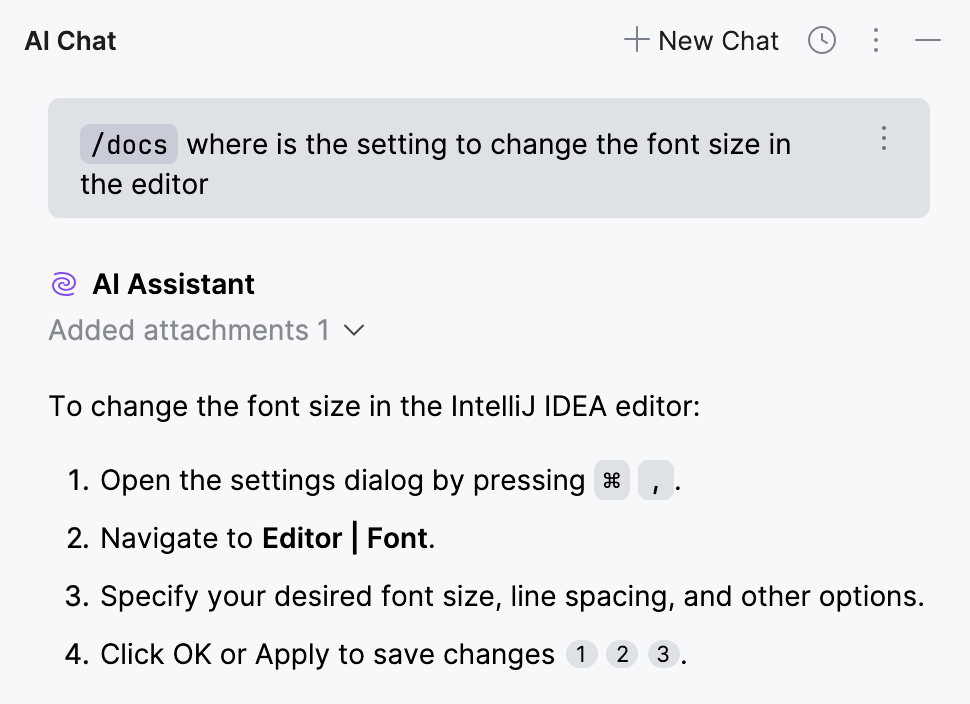
If you have the AI Assistant plugin installed, you can ask questions about the IDE right in the chat.
Open the AI Assistant chat by clicking
AI Chat on the right toolbar.
Type the
/docscommand and then type your question. If applicable, AI Assistant will provide a link to the corresponding setting or documentation page.
Learn more from Start a new chat (AI Assistant documentation).
Contact support
If you can't find the information you need in the online help, you can browse the GoLand Knowledge Base. If it doesn't help either, contact the JetBrains support team.
Browse the GoLand Knowledge Base.
In the main menu, go to to create a direct request for the support team.
Report bugs
If you encounter a bug or would like to suggest a new feature, use the GoLand issue tracker.
In the main menu, go to .
Before submitting, it is a good idea to search the issue tracker for similar reports and feature requests to avoid duplicates. If you find a similar ticket, you can add a comment to it or vote for it to bring more attention from the development team.
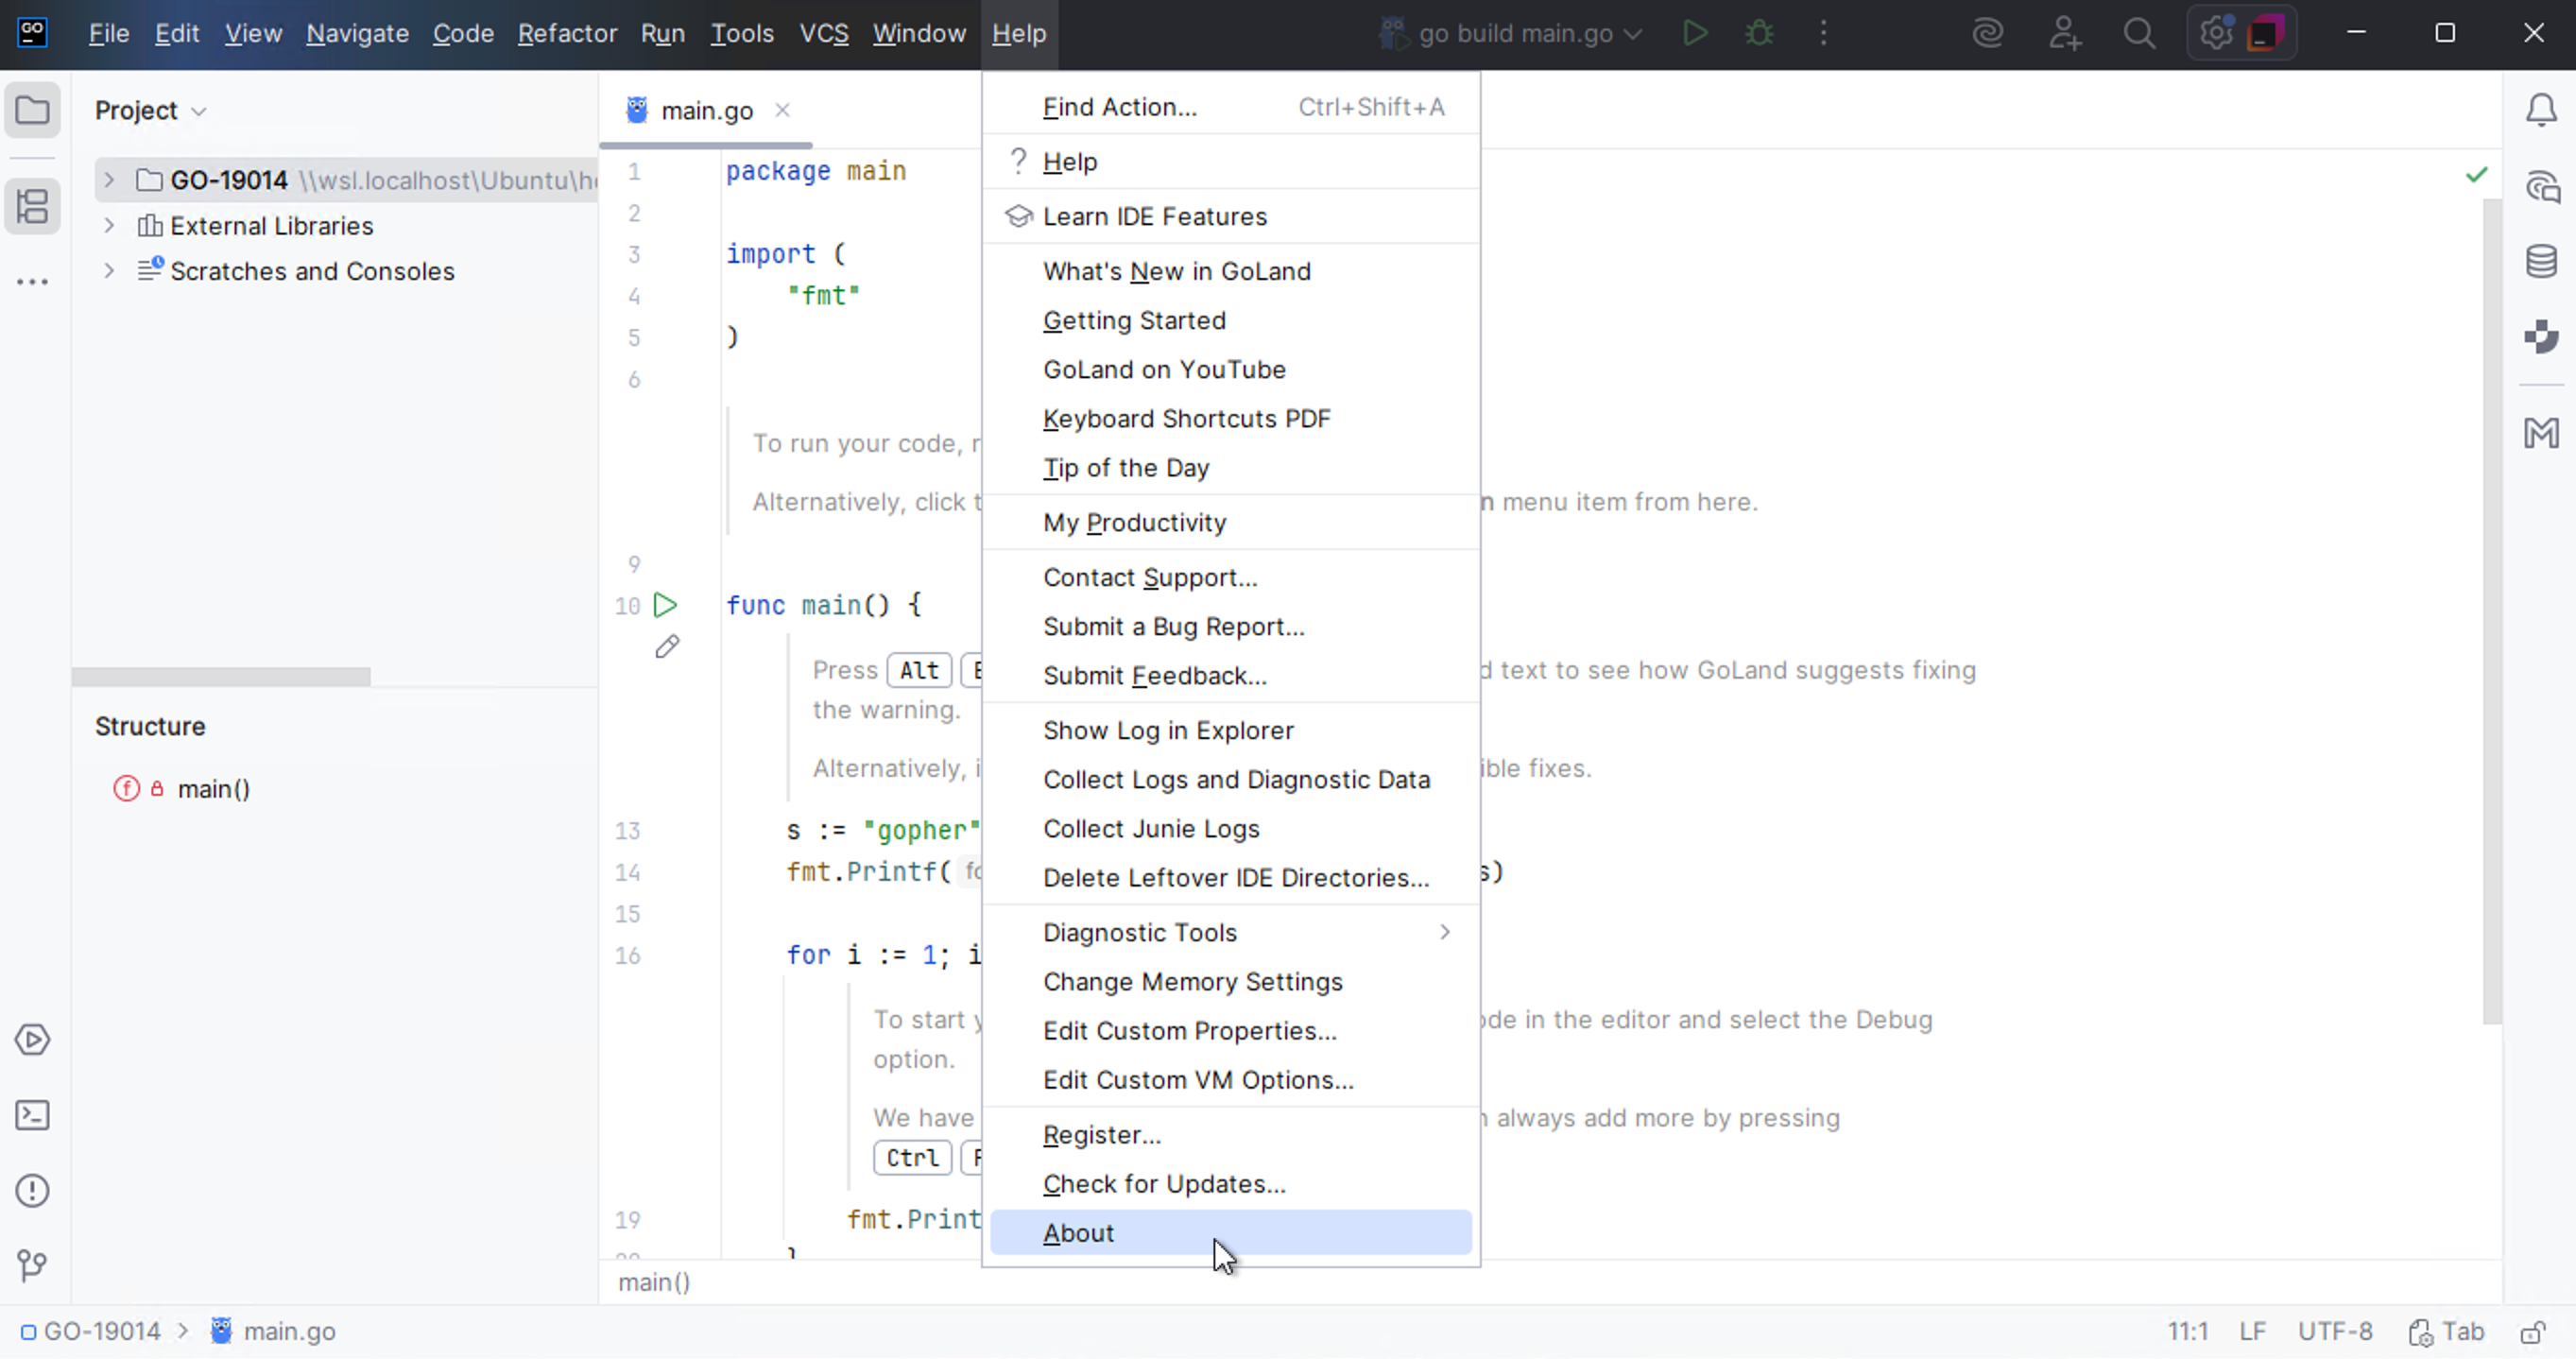
If you need to attach the GoLand log file, locate it using the relevant Help menu item:
(for Windows and Linux)
(for macOS)
Reporting performance issues
GoLand is completely frozen and does not respond to any actions? The IDE performance is slower than expected, CPU usage is high, and you suspect a memory leak? To resolve your issue, JetBrains might need a memory snapshot, profiler information, or a thread dump.
Find the information about collecting the data in Reporting performance issues.
For more information about troubleshooting these issues, refer to Reporting performance problems.
Share feedback
You can use the feedback form to tell us what you like or don't like about JetBrains products.
In the main menu, go to .
Learn more
There are several ways to learn more about GoLand:
Tips of the day provide useful hints about GoLand's features. To open the Tip of the Day dialog, select from the main menu.
If you want to get a Tip of the Day on every IDE startup, clear the Don't show tips on startup checkbox.
The Productivity Guide displays a list of useful features with statistics and tips.
To open it, select from the main menu.
To discover new features, sort the list by group and note rarely used features in the same group as the ones you use more frequently. Click the feature to see its usage description.
The IDE Features Trainer is a tool for learning the most common and useful actions. It is a sequence of lessons that interactively guide new users through the shortcuts with real-world examples.
To use it, select from the main menu.
Need assistance with GoLand? Look for an answer in YouTrack, on our discussion forum, on Twitter, or contact the GoLand team by email.
Troubleshooting materials
Consider attaching some troubleshooting materials for a more precise and quick answer. The following materials might be helpful for our investigation: log files, screenshots, animations, videos, database dumps.
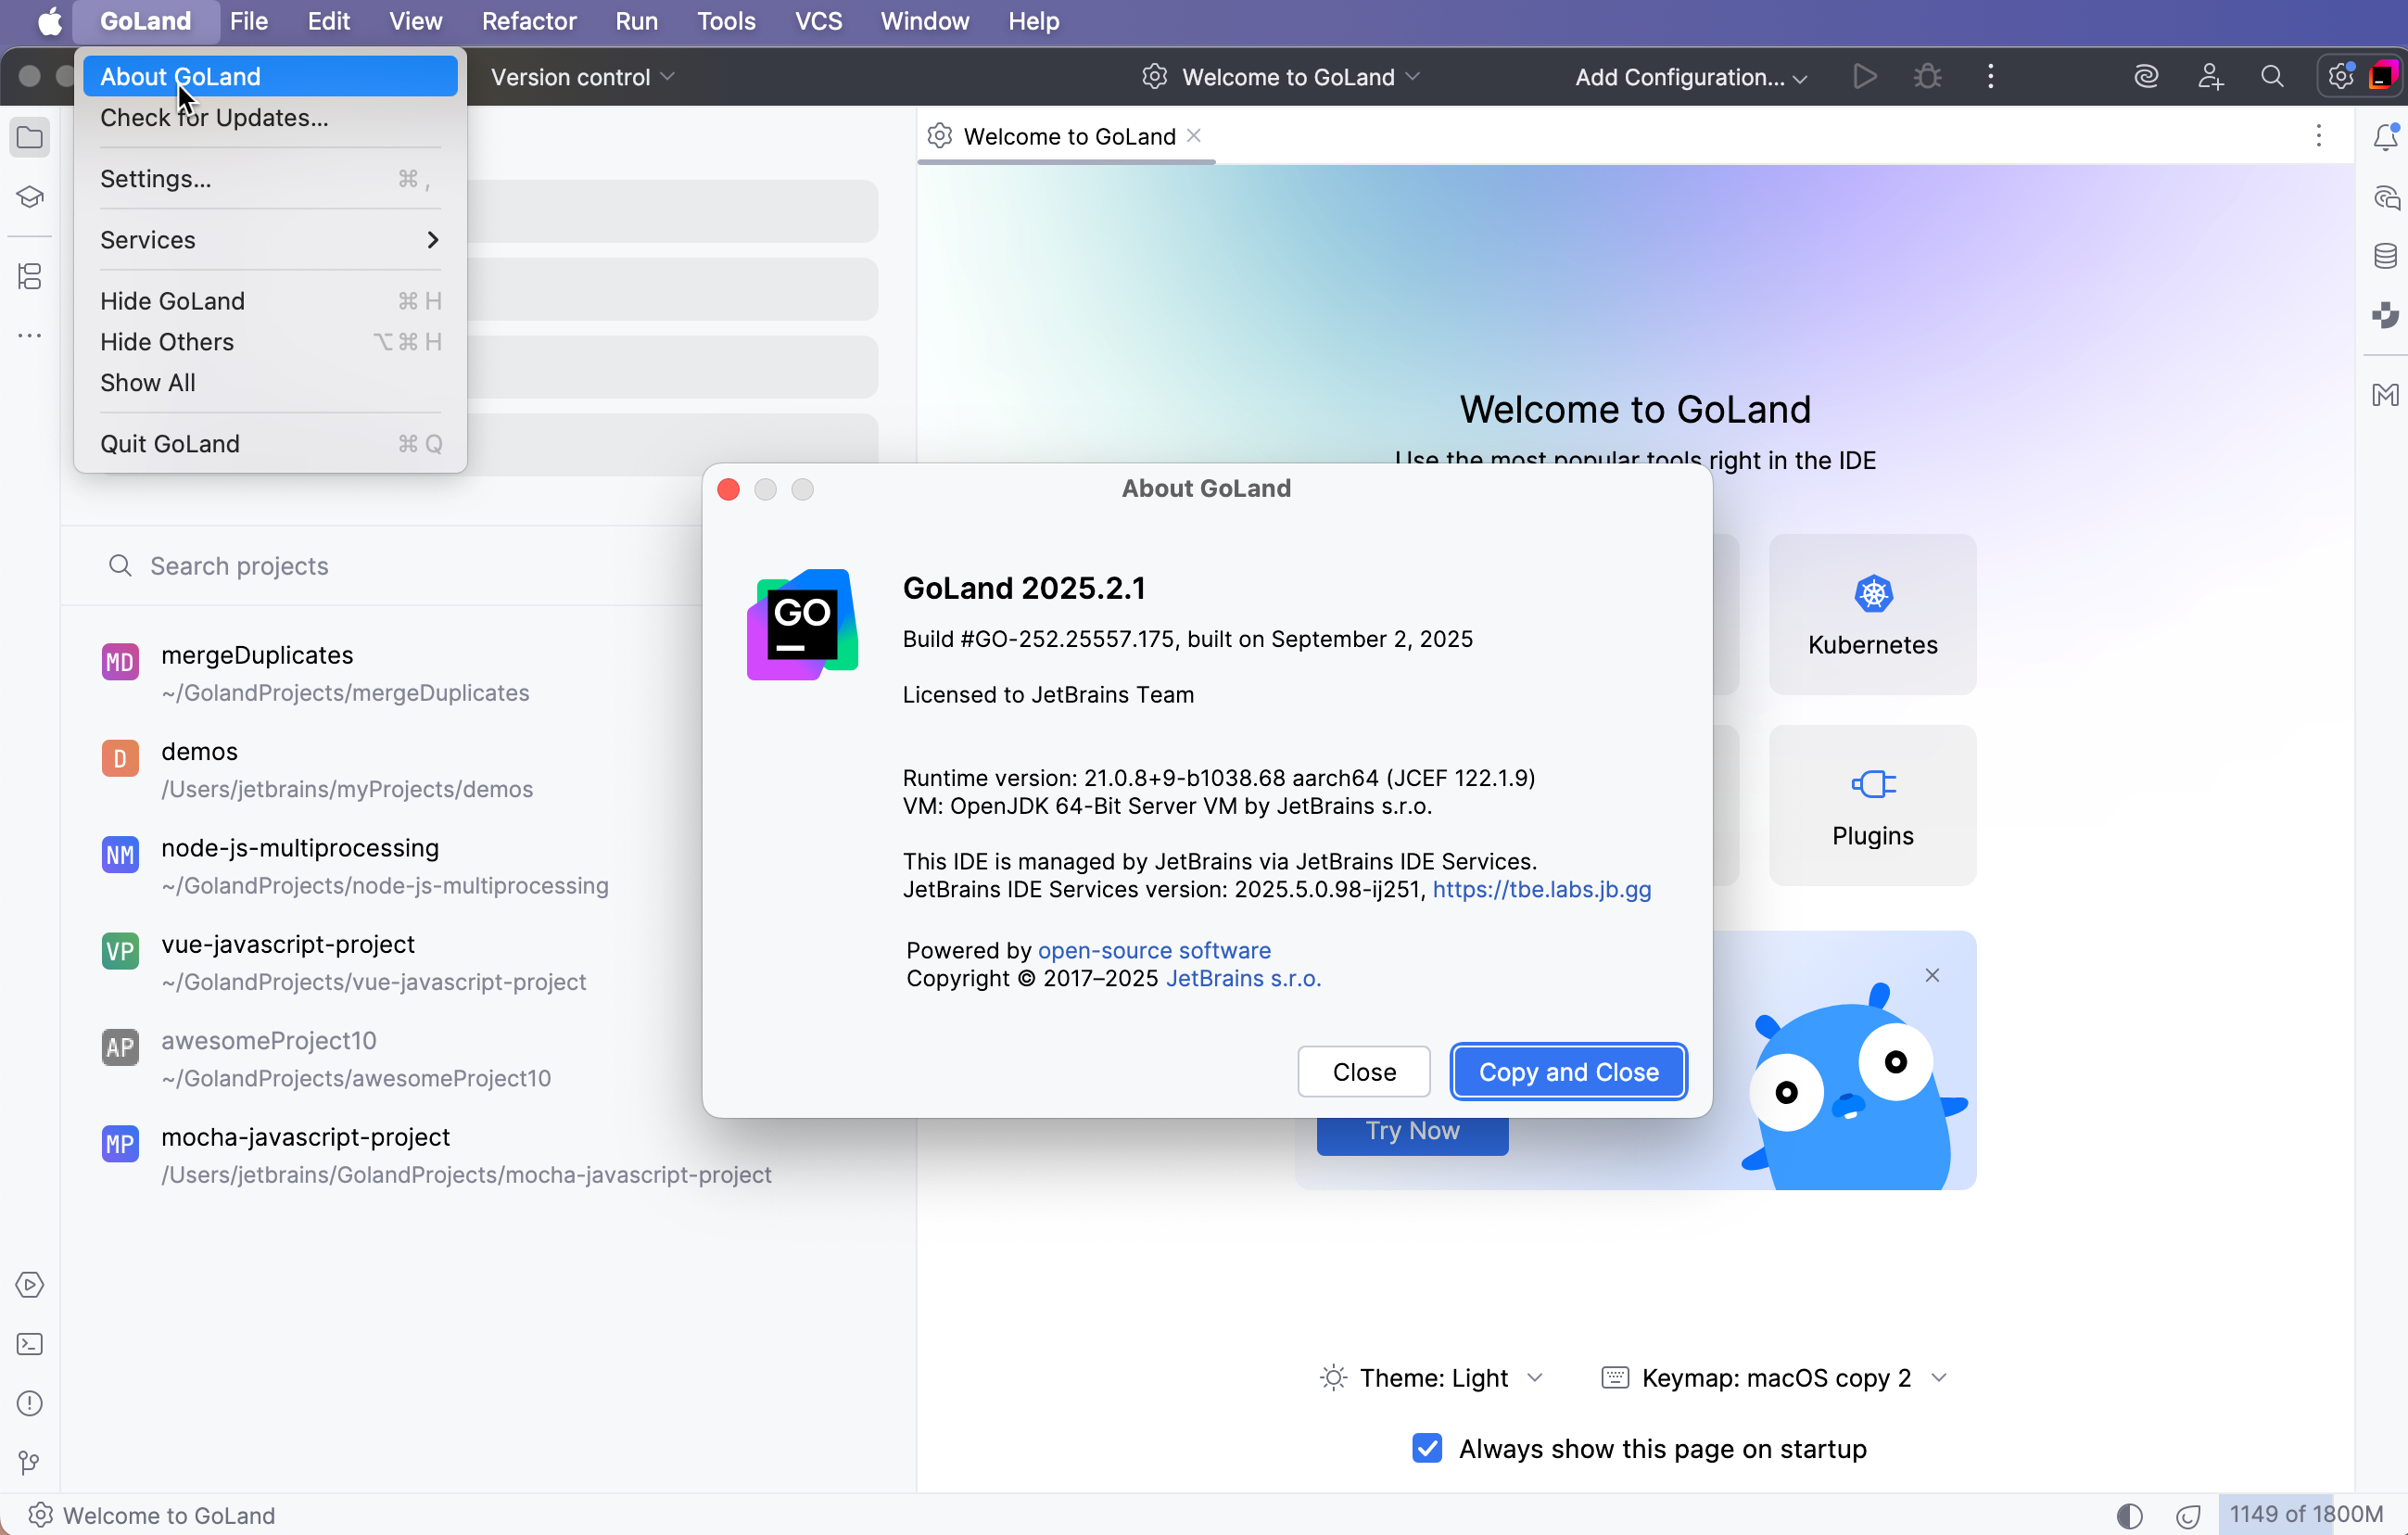
Copy GoLand version and system information
You can get product and system information by using the following actions:
Use product help menu.
For macOS, click .
For Windows and Linux, click .
Click Ctrl+Shift+A, type
About, and press Enter.
Click the copy icon
and paste it in your YouTrack ticket, email message, support request.
Locate GoLand log
Click . The idea.log file contains recent log information about your IDE performance.
Configure GoLand log settings
To avoid editing the log.xml file itself, GoLand suggests a handy dialog to change logging level for a category. This file resides under the bin directory of GoLand installation.
Click .
In the Custom Debug Log Configuration dialog, type the log categories names, separated with new lines.


