Run tests
Run the selected test or test folder:
Stop the current test session:
If your tests don't require any specific actions before start, and you don't want to configure additional options, such as code coverage, you can run them by using the following options:
Place the caret at the test, and press . Alternatively, click the
gutter icon next to the test and select Run '<test name>' from the list.
The gutter icon changes depending on the state of your test:
The
gutter icon marks a set of tests.
The
gutter icon marks new tests.
The
gutter icon marks successful tests.
The
gutter icon marks failed tests.
 Gif
GifTo run all tests in a file, select this file in the Project tool window , and then select Run '<filename>' from its context menu.

When you run a test, WebStorm creates a temporary run configuration. You can save temporary run configurations, change their settings, share them with other members of your team. For more information, refer to Run/debug configurations.
Create a new run configuration or save a temporary one.
Use the Run widget on the main toolbar to select the configuration you want to run.
Click
or press .

In the Structure tool window, right-click a test and select
Run 'method name' ().

WebStorm creates a temporary run configuration with this test. To re-use theis configuration, save it and edit, if necessary.
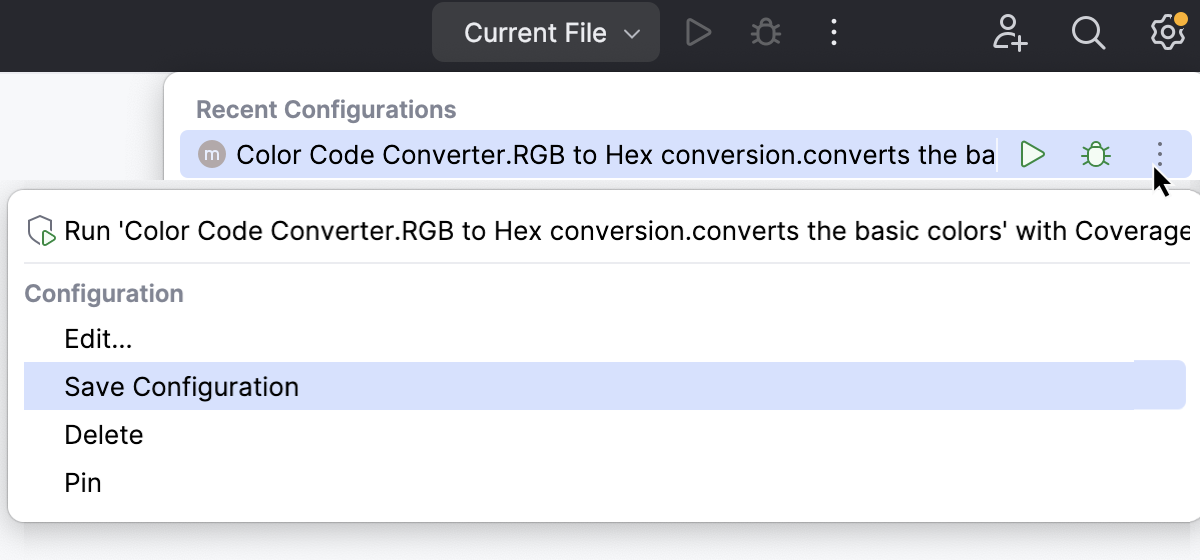
Open the Run/Debug Configuration dialog by doing one of the following:
From the configuration switcher on the main toolbar, select Run | Edit Configurations.
Go to Run | Edit Configurations.
Press and select Edit Configuration from the context menu.

Click
on the toolbar and select the desired configuration type:
Jest. See Jest and Run/Debug Configuration: Jest.
Karma. See Karma and Run/Debug Configuration: Karma.
Mocha. See Mocha and Run/Debug Configuration: Mocha.
Node.js test runner. See Built-in Node.js test runner.
DartUnit for testing Dart, see Run/Debug Configuration: Dart Test.
In the dialog that opens, specify the test scope, configuration parameters, and activities to perform before test execution. Apply the changes and close the dialog.
tip
To preserve the tab of a run configuration even if you execute another run configuration, you may pin it.
After WebStorm finishes running your tests, it shows the results in the Run tool window on the tab for that run configuration. For more information about analyzing test results, refer to Explore test results.
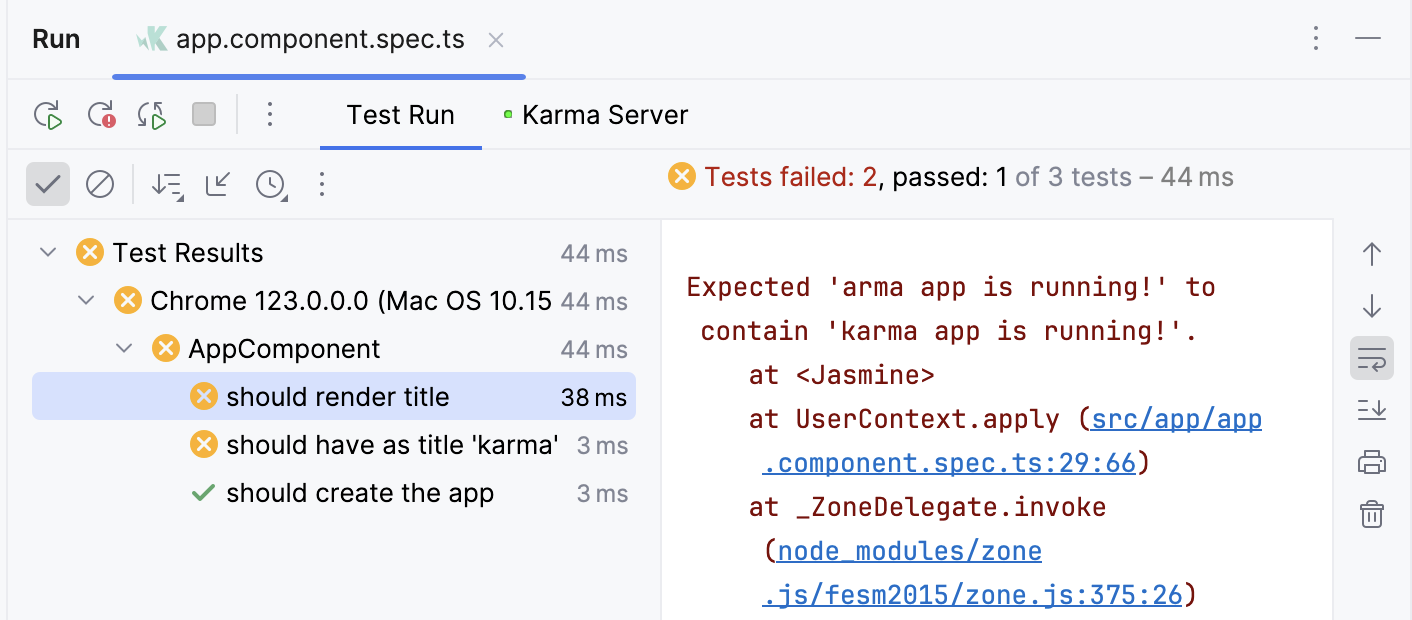
The console on the right shows the output of the current test session. The test results toolbar located above the list of test results provides you with several helpful options.

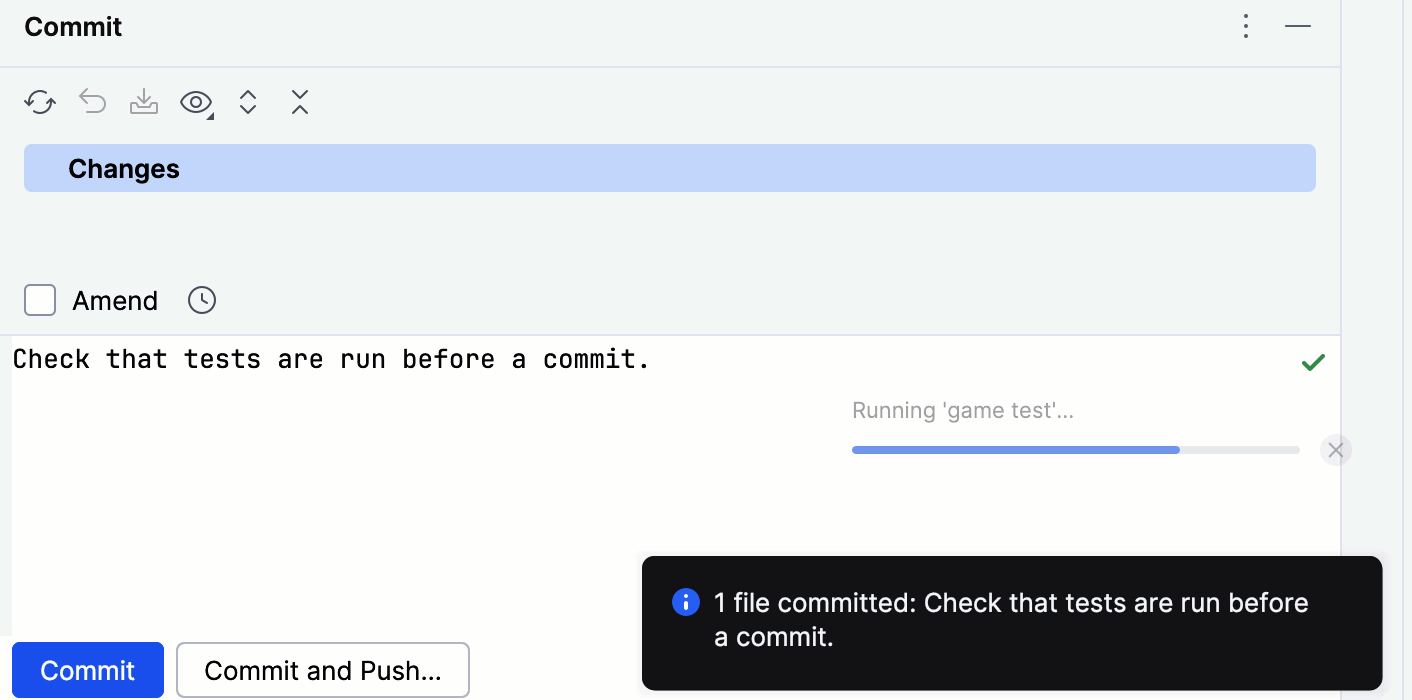
When you want to check that your changes wouldn't break the code before pushing them, you can do that by running tests as commit checks.
note
Make sure you have at least one valid run/debug configuration for tests.
Press to open the Commit tool window and click Show Commit Options
.
Under the Commit Checks menu, next to the Run Tests option, click Choose configuration and select which configuration you want to run.

After you have set up the test configuration, the specified tests will run every time you make a commit.
Use the following options on the test results toolbar of the tab for the run configuration:
Click
or press to terminate the process immediately.

Right-click a test on the tab for the run configuration in the Run tool window and select Run 'test name'.
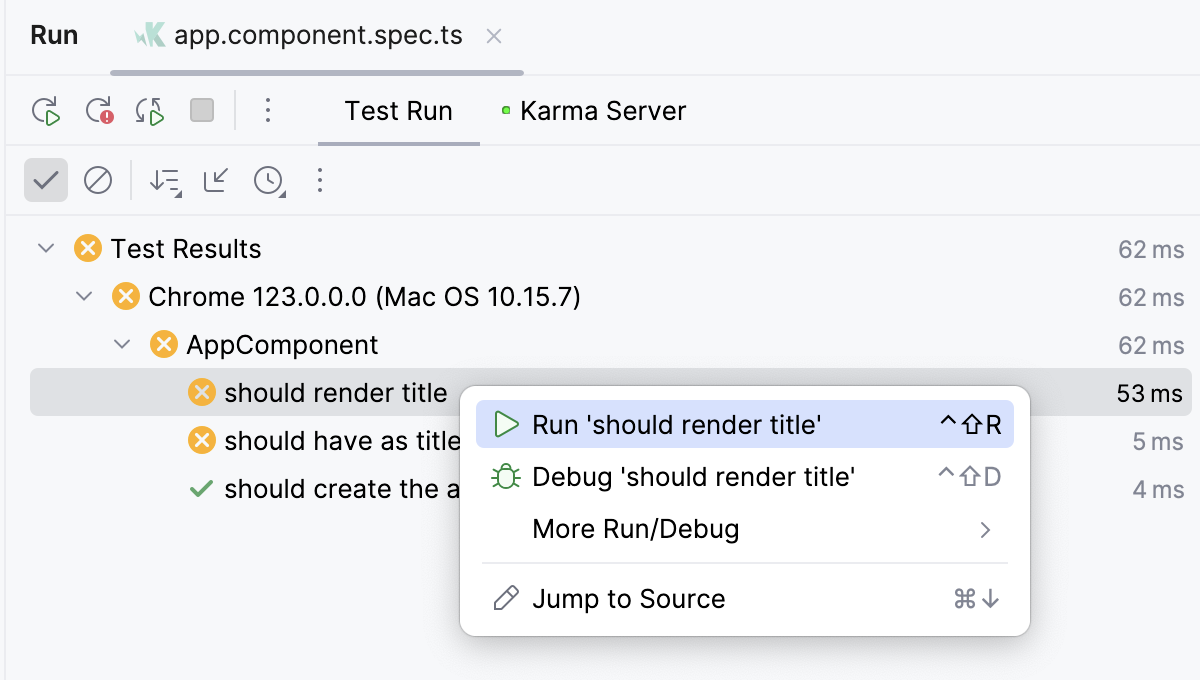
Click
on the Run toolbar or press to rerun all tests in a session.
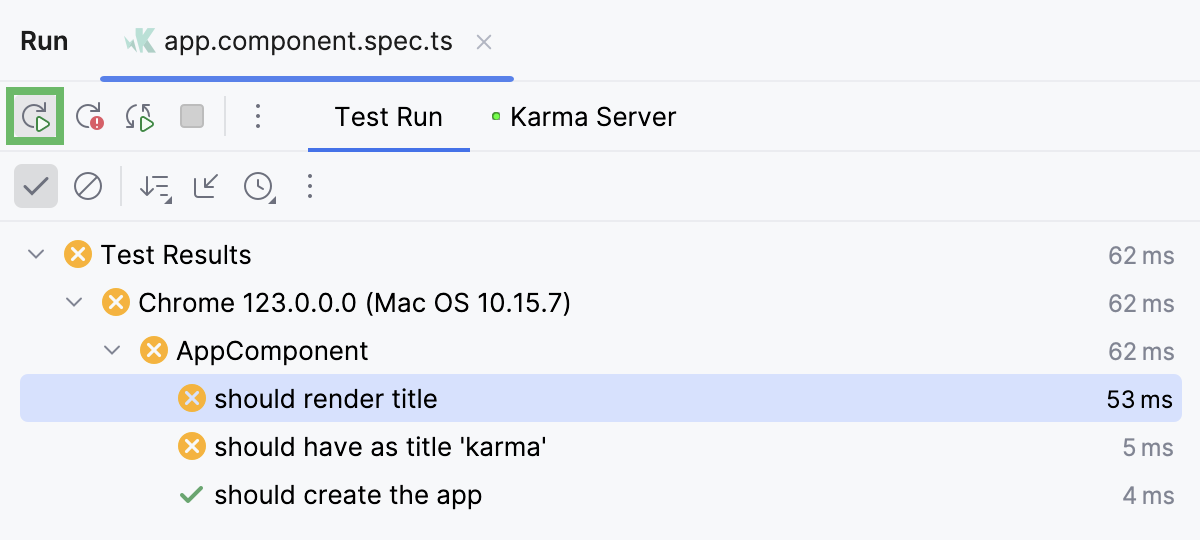
Click
on the test results toolbar to rerun only failed tests.

You can configure the IDE to trigger tests that were ignored or not started during the previous test run together with failed tests. Click
on the Run toolbar and enable the Include Non-Started Tests into Rerun Failed option.
In WebStorm, you can enable the autotest-like runner: any test in the current run configuration restarts automatically after you change the related source code.
Click
Rerun Automatically on the test results toolbar to enable the autotest-like runner.
 Gif
Gif
If you don't know why a test fails, you can debug it.
In the editor, click the gutter on the line where you want to set a breakpoint.
There are different types of breakpoints that you can use depending on where you want to suspend the program. For more information, refer to Breakpoints.
Right-click the
gutter icon next to the failed test and select Debug 'test name'.
The test will rerun in debug mode. After that, the test will be suspended, allowing you to examine its current state.
You can step through the test to analyze its execution in detail.
 Gif
Gif