Problems tool window
View | Tool Windows | Problems
Alt06
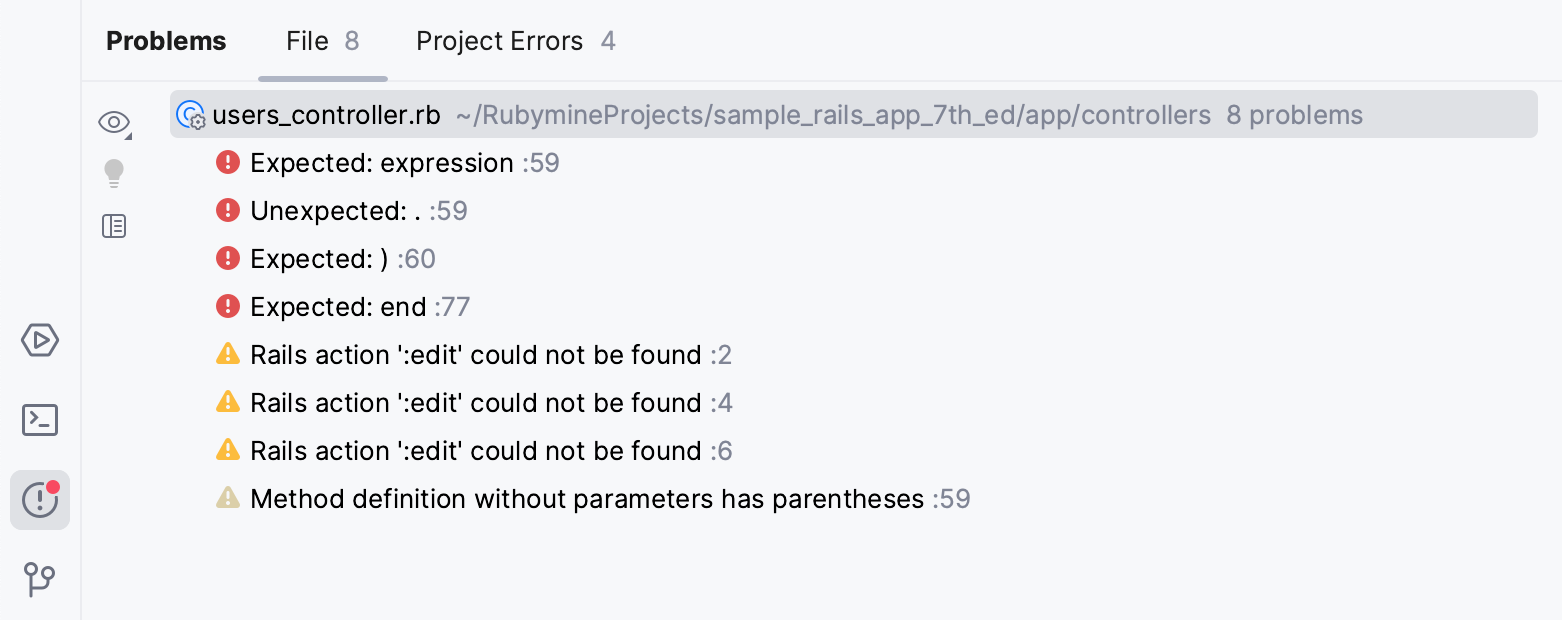
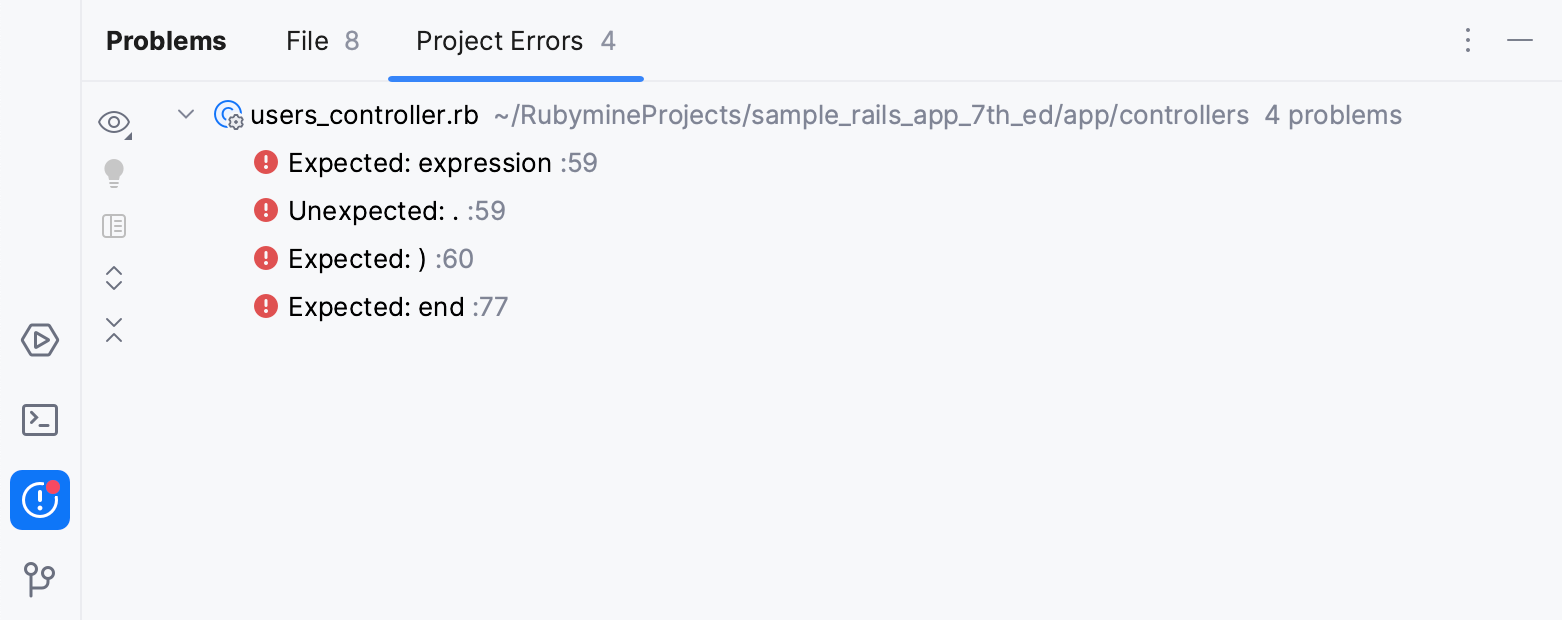
The Problems tool window displays problems that RubyMine detects in your project using several tabs.
You can select any problem in the window and press F4 or double-click it to jump to the corresponding line in the editor.
To cycle through the tool window tabs, press Alt0→ and Alt0←.
When the design-time code inspection is enabled, this tab lists all code issues found in the current file. The list is updated as you switch between files in the editor.

Item | Tooltip and shortcut | Description |
|---|---|---|
View Options | Filter out code issues by their severity and configure their sorting. When no grouping or sorting options are selected, the issues are listed in the order they appear in the file. | |
| Show Quick-Fixes AltEnter | Show quick-fixes available for the selected problem. |
Open Editor Preview | Open the preview pane to view the selected issue in its source context right in the Problems window. Note that this preview is a normal editor where you can change the code and apply available quick-fixes. |
Item | Shortcut | Description |
|---|---|---|
Show Quick-Fixes | AltEnter | Show quick-fixes available for the selected problem. |
Copy Problem Description | Ctrl0C | Copy the problem description to the clipboard. |
Jump to Source | F4 | Open the code containing the problem in the editor. |
Show Error Details | Open error details in a separate dialog. |

Item | Tooltip and shortcut | Description |
|---|---|---|
View Options | Filter out code issues by their severity and configure their sorting. When no grouping or sorting options are selected, the issues are listed in the order they appear in the file. | |
| Show Quick-Fixes AltEnter | Show quick-fixes available for the selected problem. |
Open Editor Preview | Open the preview pane to view the selected issue in its source context right in the Problems window. Note that this preview is a normal editor where you can change the code and apply available quick-fixes. | |
Expand All | Expand all nodes. | |
Collapse All | Collapse all nodes. |
Item | Shortcut | Description |
|---|---|---|
Copy Problem Description | Ctrl0C | Copy the problem description to the clipboard. |
Jump to Source | F4 | Open the code containing the problem in the editor. |
Show Error Details | Open error details in a separate dialog. |

Item | Shortcut | Description |
|---|---|---|
CtrlF5 | Run the inspection and show the results on the same tab. | |
CtrlAlt0↑ | Navigate to the previous problem. | |
CtrlAlt0↓ | Navigate to the next problem. | |
| AltEnter | Resolve the problem for the selected inspection item by choosing one of the available quick fixes from the list. |
Change the settings for the selected inspection or group of inspections in the Errors dialog. | ||
Group or filter found problems according to the selected option:
| ||
CtrlNumPad + | Expand all nodes. | |
CtrlNumPad - | Collapse all nodes. | |
Export the inspection results into XML or HTML format. |
Item | Shortcut | Description |
|---|---|---|
Jump to Source | F4 | Open the file that contains the selected problem in the editor and place the caret at the beginning of the corresponding code fragment. |
Find Usages | AltF7 | Search for usages of the selected file. |
Exclude | Delete | Exclude the selected items from further examination. Excluded nodes are shown strikethrough. If the filter toggle |
| AltEnter | Select one of the suggested solutions. |
Suppress problem | Suppress the inspection for a class, method, statement, or field. For more information, refer to Suppress inspections. | |
Edit Settings | Change the settings for the selected inspection or group of inspections in the Errors dialog. | |
Disable inspection | Disable alerts for the selected inspection in the active tab of results. If the filter toggle | |
Run inspection on | Rerun the selected inspection and display the results on a new tab. |
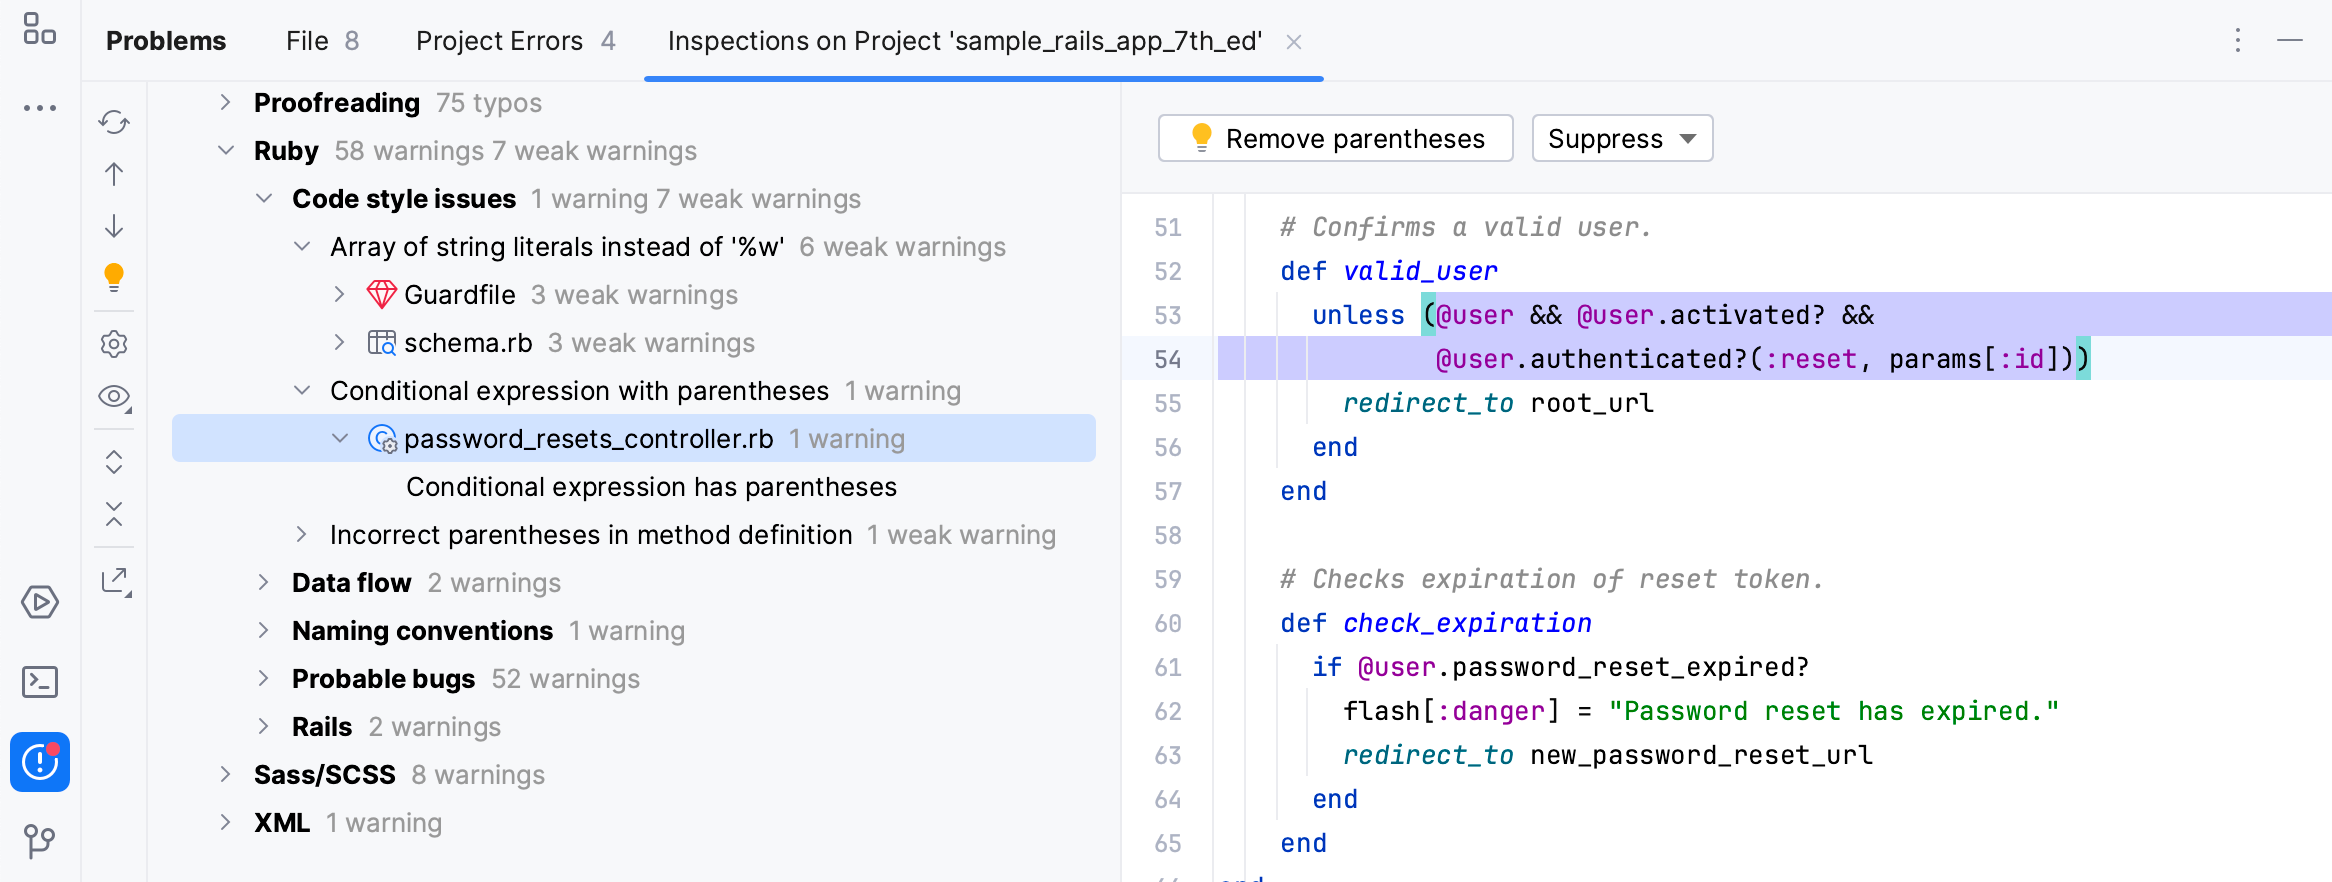
The inspection report is shown in the right pane of the results tab when an inspection node is selected in the left pane. The report may include the following:
Problem resolution: A button for each of the available solutions. Clicking a button invokes the corresponding fix. If no buttons are present, you have to fix the problem yourself.
Suppress: Click this button to reveal the list of inspection suppress options.
Problem synopsis: A brief description of the problem.
Disable inspection: Disable alerts for the selected inspection in the active tab of results. If the filter toggle
is on, the nodes for disabled inspections are hidden.
Run inspection on: Rerun the selected inspection and display the results on a new tab.
Thanks for your feedback!