Visualize data structures
When debugging, JetBrains Rider lets you visualize data structures in your code in a tabular form. This helps you quickly understand the structure, contents, and transformations of your data. It simplifies the process of understanding complex patterns in your code, which ultimately enhances your debugging efficiency.
Imagine that in the debugging context you have orders variable that contains the results of a database query, and you want to study the contents of this variable. One way to approach this would be to use the Evaluate Expression dialog and write different expressions involving orders.
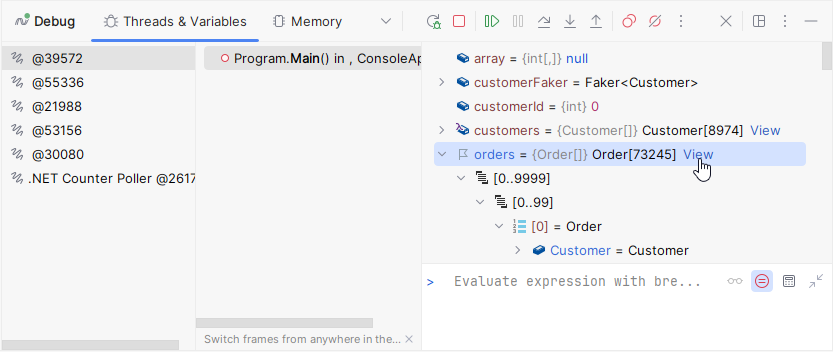
A much more convenient way is to explore the contents visually in a tabular view. To do so, we can locate the orders variable in the Debug window and click View next to it:

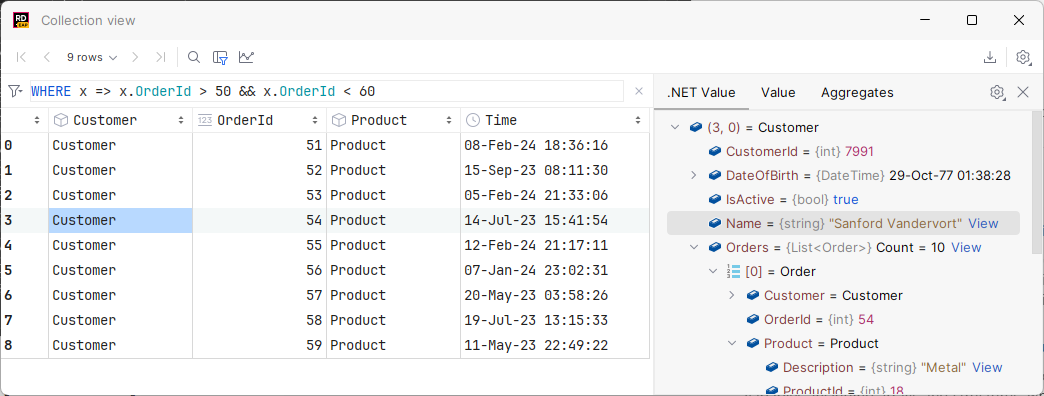
This will open the Collection view dialog displaying the variable contents:

The dialog works as a familiar table viewer with all typical features.
By default, when you issue a query, the number of returned rows is limited to 500. This limitation is introduced to avoid an overload (for example, when your
SELECTstatement returns one million rows).To change this limit, open settings and navigate to Tools | Database | Data Editor and Viewer. In the Limitations | Limit page size to field, specify a new number. To disable the limitation, clear the Limit page size to checkbox.
Click the current row range on the toolbar and select the desired value.

Depending on the value of the Limit page size to parameter, the result set might be divided into several pages. For example, you set the Limit page size to parameter to 100, but your query returned 200 rows. You will have two pages of rows, with 100 rows on each page. To navigate between pages, use the following controls:
: Navigates to the first page of the result set.
: Navigates to the previous page of the result set. Alternatively, press .
: Navigates to the next page of the result set. Alternatively, press .
: Navigates to the last page of the result set.
To find textual occurrences on the current page, press or click Find on Current Page
, and then use the text field and search options that appear.
To examine the data in specific sells, click a cell or click multiple cells while holding down . The selected object will be displayed on the right.
To filter the data globally, write a query in the filter area above the table.
tip
If the global filter filed is hidden, click Show Options Menu
and select Show Filter
To filter data in specific rows, click Enable Local Filter on the toolbar, and then use the filter icons that appear on the column headers.
To sort data rows by a specific column value, click the corresponding column header.
Click Export Data on the toolbar.
Configure export preferences and click Export to File.
