Code Inspection in F#
JetBrains Rider's code analysis in F# is provided by the F# Compiler Service. Nevertheless, the key code analysis features supported in C# and VB.NET (except for quick-fixes) are also available in F#. For more information about these features, refer to the Code Analysis section where you'll also find useful keyboard shortcuts.
This functionality relies on the F# Support plugin, which is bundled and enabled in JetBrains Rider by default. If the relevant features are not available, make sure that you did not disable the plugin.
Press to open settings and then select Plugins.
Open the Installed tab, find the F# Support plugin, and select the checkbox next to the plugin name.
The analysis is performed by applying code inspections to the current document or in any specified scope.

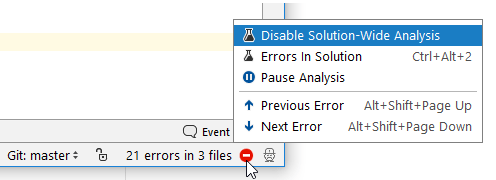
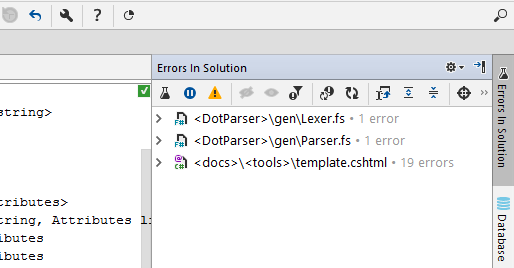
JetBrains Rider not only analyzes errors in the current file, but also inspects the whole solution taking the dependencies between files into account.

Open the All Solution Files tab of the Problems window to view the results of analysis.

For more information, refer to Solution-wide analysis.
Inspect This is a shortcut to several powerful analysis features that allow you to see how values and method calls flow through your code. The list of available features depends on the current context.

For more information, refer to Call tracking and Value tracking.