Error stripe and status indicator
Error stripe and status indicator visualize the results of the design-time code inspection in the current file and help navigate between code issues. Also, the error stripe displays special marks for other features, such as bookmarks or highlighted usages.
Error stripe
Error stripe is a sidebar integrated into the editor scroll bar . It can show the following items as individual markers:
Code issues found by JetBrains Rider's design-time inspection.
Other items, for example, breakpoints, can be configured to have their own markers.
Markers have different colors representing different kinds of corresponding items. Colors may vary between various color schemes, but you can configure error stripe colors for each item kind individually.
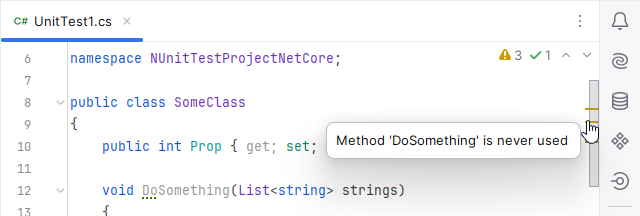
The position of a marker on the bar indicates the relative position of the corresponding item in the file. You can get popup tips for each item by placing the mouse pointer over markers, and you can navigate directly to relevant lines of code by clicking on them.

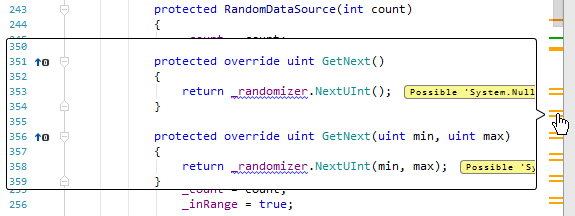
If the code corresponding to the marker is outside the visible editor area, and Show code lens on scrollbar hover is enabled on the page of JetBrains Rider settings Ctrl+Alt+S, this code fragment with the corresponding code issues will appear in a popup when you hover over the marker.

Configure the appearance of the error stripe
Press Ctrl+Alt+S or choose (Windows and Linux) or (macOS) from the menu , then choose on the left.
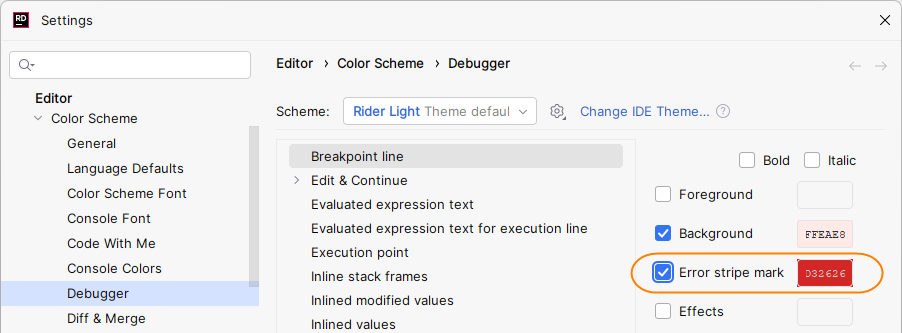
Choose an item in the list and use the Error stripe mark checkbox to show or hide it on the error stripe; use the color picker next to it to choose the color to represent the item on the error stripe.
You can find settings for more editor items on other settings pages under . For example, breakpoints do not have any markers by default, but you can enable them on the Debugger page:

If you are not sure how to find the item marked on the error stripe, you can locate its settings in the following way:
Click the error stripe marker so that your caret gets to the related item in the editor.
Press Ctrl+Shift+A, start typing
jump to colors and fontsand pick this command in the list.You will see all appearance properties that affect the item and its presentation on the error stripe. In the example below, the yellow error stripe mark is displayed for the Warning.

When you pick this property, you will get directly to its settings.
Status indicator
Status indicator — by default, is shown as widget with number of issues in the top-right corner of the editor, or in the Compact View mode, as an icon at the top of the error stripe. It shows the status of the code inspection in the current file . When you click it in the compact view mode a popup appears to show the total number of errors and warnings in the current file . If coverage information is available for the current document, the indicator contains an additional icon with unit test coverage data.

Context menu of the status indicator
You can also right-click the status indicator and then click to use the following commands and options from its context menu:
Configure Inspections | Opens code inspections settings, where you can change severity levels of specific inspections or disable them altogether. |
Show Auto-Import Tooltip | If this option is selected, a popup that suggests importing namespaces in C# and VB.NET shows up if one or more non-imported types are detected in the file:  The option is synchronized with the Show the 'Import missing references' popup in editor option on the page of JetBrains Rider settings Ctrl+Alt+S. |
Compact View | When enabled, the status indicator is shown as a single icon at the top of the error stripe. |
Meanings of status indicator icons
Status Indicator can have different icons with the following meanings:
| Whenever you see a red marker, it means that the file contains errors that would either prevent the project from compiling or lead to exceptions in runtime, unless Treat warnings as errors is enabled in project properties. |
| A yellow marker means that there are some warnings, but no errors that would prevent the project from compiling. |
| A green marker means that your code doesn't contain errors or warnings, but there still can be code issues with minor severity levels (Suggestion or Hint). |
The status indicator shows the icon in the following cases:
- Design-time inspection is disabled globally
You can re-enable it by selecting Enable code analysis on the page of JetBrains Rider settings Ctrl+Alt+S.
- Code inspection is disabled in the current file
The current file is excluded from code analysis: it is listed explicitly, by its containing folder, or by the file mask in the Elements to skip section on the page of JetBrains Rider settings Ctrl+Alt+S.
You can press Ctrl+Alt+Shift+8 to toggle code analysis for the current file; this will also add it to or remove it from the Elements to skip list.
- Design-time code inspection is disabled because the file is too large
To optimize performance and memory consumption, JetBrains Rider automatically disables design-time inspection in files that are larger than
300kilobytes. You can press Ctrl+Alt+Shift+8 in each of such files to enable code analysis.If the file size exceeds
2500kilobytes, then all JetBrains Rider features including coding assistance will be disabled in that file and pressing Ctrl+Alt+Shift+8 will have no effect. This limit can be extended globally with theidea.max.intellisense.filesizeIDE property.- File is not analyzed because it is not included in the solution
JetBrains Rider needs to have a solution model to analyze symbols and references used in each file. Therefore, it cannot analyze files that are not included in the current solution (except some self-contained files such as .xml) .
This often happens with decompiled files and files from symbol servers that open as you navigate compiled code. You normally don't want to analyze such files because there is no way to make meaningful edits to them.
If, on the other hand, you have opened a file for editing by drag-n-dropping it from the system file manager or via , then you either need to open the solution where the file belongs or include the file in the current solution (right-click a target project and choose ).
- An internal error occurred when analyzing the file
In some rare cases, there might be internal errors that prevent JetBrains Rider from analyzing a file. In such cases, clean the analysis indexes and restart the IDE: choose from the main menu.