Explore project dependency diagram
warning
Project dependency diagrams only work for C# and Visual Basic projects.
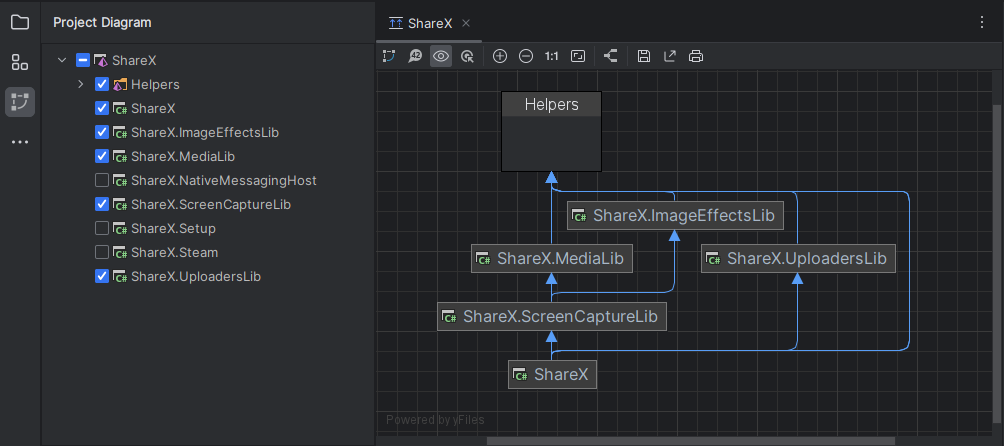
With JetBrains Rider, you can explore project dependencies in your solution having a visual presentation of the solution architecture.
The Architecture view opens in a new editor tab and allows visually exploring project dependencies and comparing the current state of the solution to snapshots taken earlier.

tip
If the coupling analysis is enabled, building the dependency diagram for large solutions can take some time. However, the analysis is performed asynchronously and without building the solution. So you can continue working with code while the diagram is being built.
Choose Tools | Architecture | Show Project Diagram from the main menu or right-click anywhere in the Solution Explorer and choose Tools | Show Project Diagram.
The project dependency diagram follows your solution structure, and starts by showing all top-level items in your solution.
JetBrains Rider builds the diagram in two steps:
Build the dependency diagram based on the project references.
This step is done automatically when you open the diagram and it takes almost no time even for large solutions.
Perform the coupling analysis to calculate numbers of usages in the referencing project.
This step is resource-intensive and can take up to several minutes, but it runs in the background. The progress of the analysis is reflected on the status bar .
The state of the coupling analysis corresponds to the state of the Enable Coupling Analysis
.png) button. The coupling analysis is a resource-intensive process and may affect performance on large solutions. If you experience any lags when working with the diagram, you can use this button to disable the coupling analysis, adjust the diagram as needed, and then enable the analysis again. The analysis algorithm first calculates the coupling of the displayed projects and then processes projects hidden from the view.
button. The coupling analysis is a resource-intensive process and may affect performance on large solutions. If you experience any lags when working with the diagram, you can use this button to disable the coupling analysis, adjust the diagram as needed, and then enable the analysis again. The analysis algorithm first calculates the coupling of the displayed projects and then processes projects hidden from the view.
Links between projects in the diagram can be displayed in the following ways:
Line style | Meaning |
|---|---|
Thin blue solid line | Shows that there is a project reference between the two nodes. These lines are used when coupling analysis is either in progress or disabled, so the number of usages between projects is unknown. |
Blue solid line of specific width | The coupling analysis is over for this reference and at least one usage exists in the referencing project. The line thickness represents how many times types of the referenced project are used in the referencing project. If you hover over a reference, this number appears in the tooltip. |
Dotted line | Appears when the coupling analysis is over and means one of the following:
|
You can show or hide specific solution items (projects, folders, solution folders) in the diagram using check-boxes for the corresponding items in the Project Diagram window that opens automatically together with the diagram view.
To pan and zoom the diagram, use the corresponding toolbar controls. Alternatively, you can pan the diagram using your touchpad, scroll bars or the mouse wheel for vertical scrolling and Shift + mouse wheel for horizontal scrolling. You can also use Ctrl + mouse wheel for zooming.
The diagram layout is calculated automatically, but you can change it if necessary: all items can be moved. To move an item, first click it to select, and then click and drag it while the cross cursor ![]() is shown.
is shown.
You can click Apply Current Layout to return to the automatically calculated layout.
For more information about the usages of types from one project in another, enable the coupling analysis and when it is over, click the corresponding link between the projects. JetBrains Rider will show the usages in the Find window.
At any point of exploring dependencies, you can use the following toolbar button to export the diagram to a file:
Click Export to Image to export the current view of the diagram to an image. In the Export to Image dialog that opens, you can choose a file format for the image, for example, PNG or SVG.
At any time you can save a snapshot of the current state of your solution to a file and use it for future references. To do so, click Save Diagram to File on the toolbar and then choose where to save the snapshot file.
tip
The proprietary file format of the diagram snapshots .argr can be also used with JetBrains ReSharper.
You can load and study saved snapshots later by choosing Tools | Architecture | Compare with Saved in the main menu and selecting a diagram snapshot file .argr.
The snapshot will open in a new editor tab, and you will be able to see differences between the current state of the solution and the state saved in the snapshot.