Visual Studio Code
Visual Studio Code is a source code editor developed by Microsoft and available for Windows, macOS and Linux. This section shows how you can use Qodana in Visual Studio Code:
Run Qodana locally in Visual Studio Code
Explore Qodana reports local or downloaded from Qodana Cloud
Before you start
Make sure that you have a Qodana Cloud project, and this project has at least one analysis report related to the project opened by Visual Studio Code. Also, check whether Java 11 or later is installed on your machine by running the java -version command. If necessary, install Java on your local machine.
Download and install the Qodana extension from the Visual Studio Marketplace website, or by navigating to the Extensions view in Visual Studio Code.
UI overview
In the command palette, type View: Show Qodana and select the Qodana view.

This will open the Qodana view in the left part of your Visual Studio Code UI.
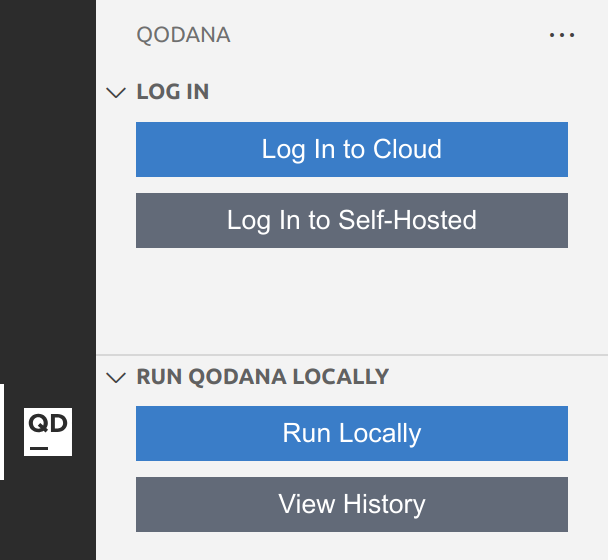
This view contains buttons leading to Qodana functionalities in Visual Studio Code.
Alternatively, in the command palette type Qodana to see the list of options present in the Qodana view.

Run Qodana locally
You can run Qodana locally and then forward analysis reports to Qodana Cloud for storage and analysis purposes.
In Visual Studio Code, navigate to the view and then click .
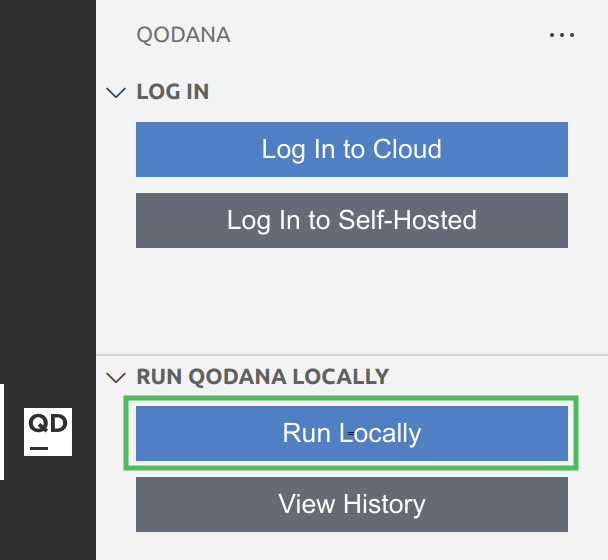
In the dialog that opens, enter the project token that was generated by Qodana Cloud.

If you have not previously specified a linter in the
qodana.yamlfile, choose it in the list that opens.
After Qodana runs, you can explore analysis results on the PROBLEMS tab of Visual Studio Code.
To see the history of local runs of Qodana and load analysis reports, in the Qodana view click the View History button and then choose the report you would like to explore.
To return the PROBLEMS tab to the default state, in the Qodana view click the Turn Analysis Off button.
Connect to Qodana Cloud
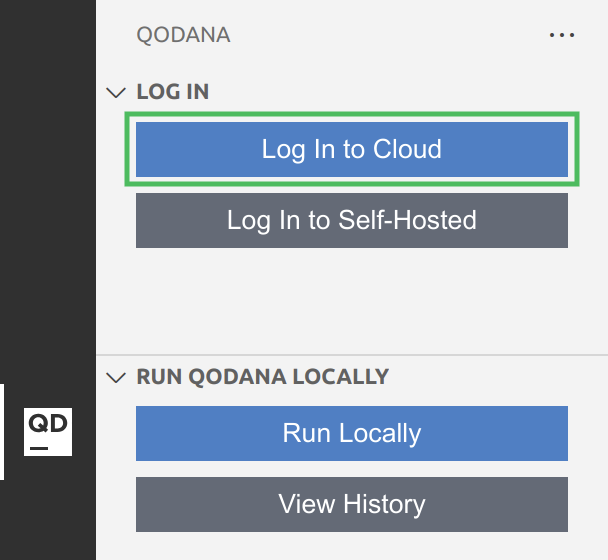
To forward Qodana reports to Qodana Cloud and get the latest Qodana reports, log in to Qodana Cloud and connect your project opened in the IDE to a specific Qodana Cloud project as shown below.
In Visual Studio Code, navigate to the view, click the button and follow the instructions for redirecting to the authentication page.
In the view, select a project in Qodana Cloud that you would like to link your local project with, and then click . If the project is not present in the list, then click
Other projectand specify the project identifier in the dialog that opens.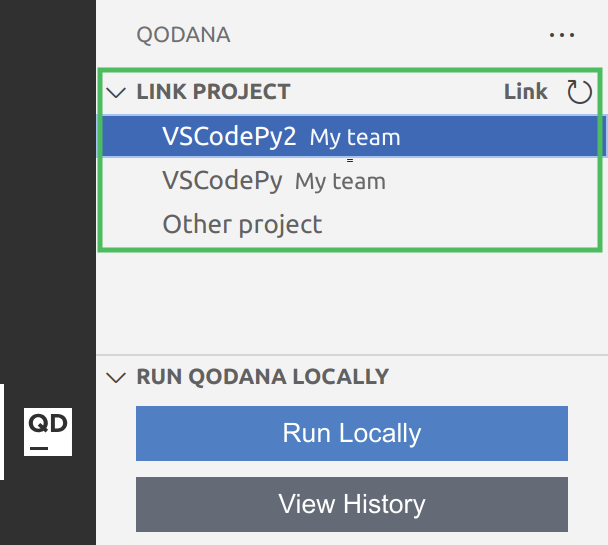
Navigate to the tab, or in the view click the button to explore analysis results.
Explore analysis results
You can explore the analysis report of Qodana using the PROBLEMS tab of Visual Studio Code.
On this tab, you can click problem items and navigate to code fragments where Qodana detected them.
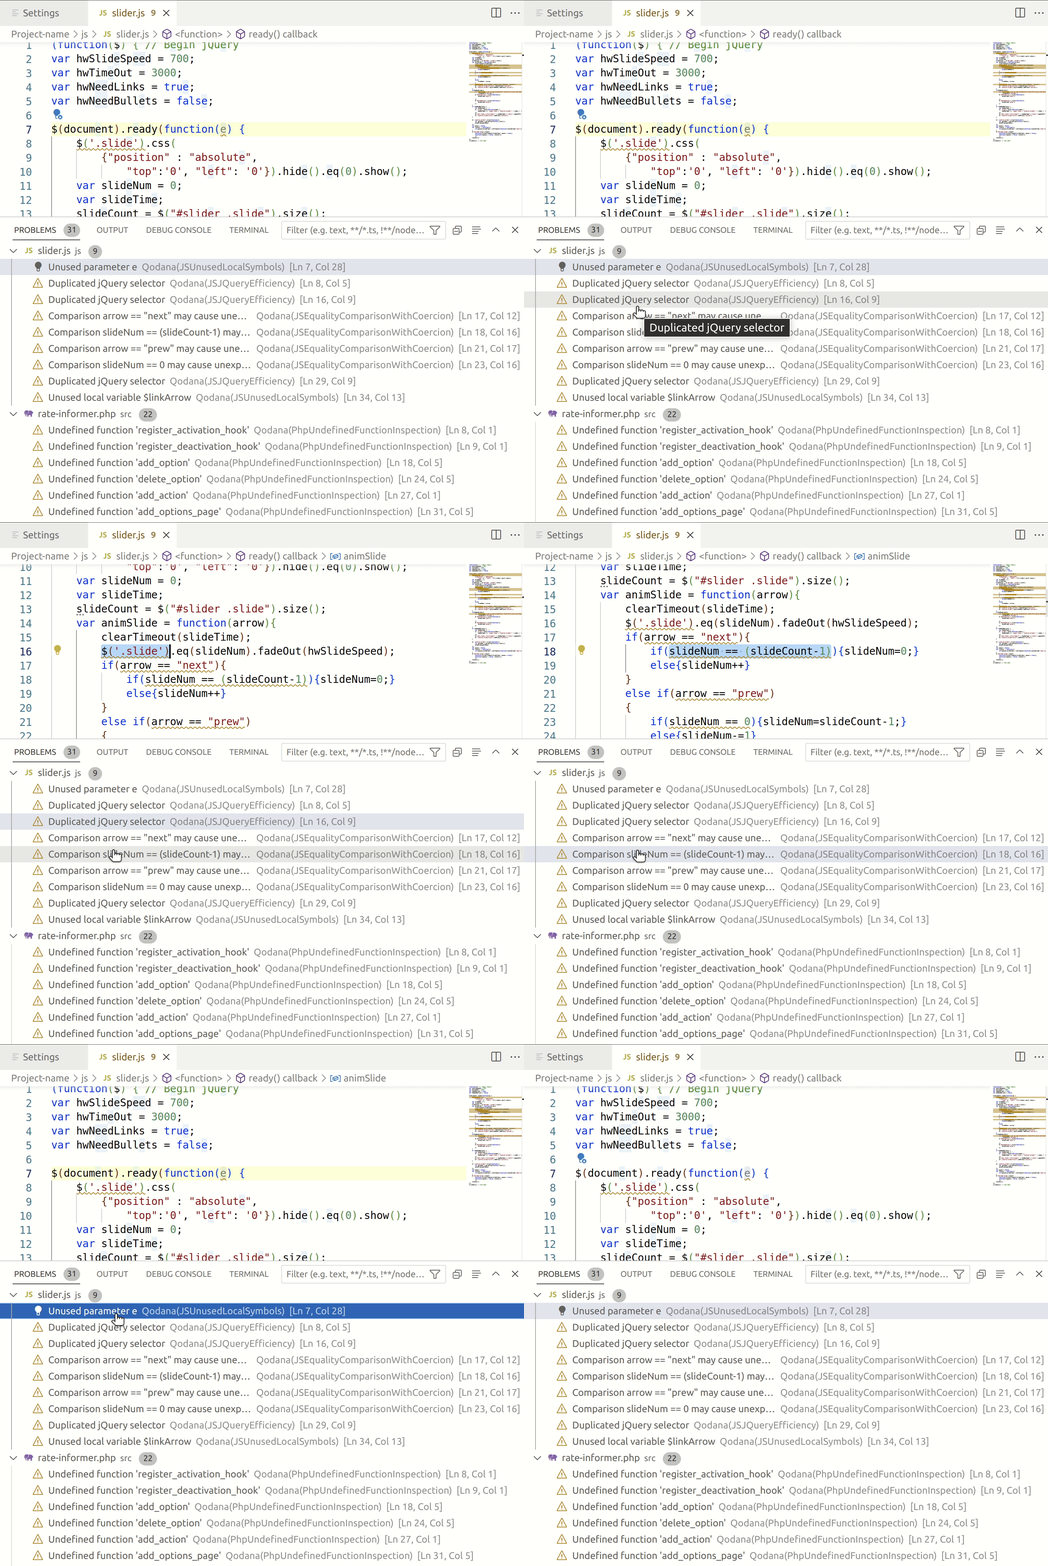
You can also view analysis reports generated after local Qodana runs using the View History button in the Qodana view.
Configure Qodana
Here is an overview of the Qodana configuration page.
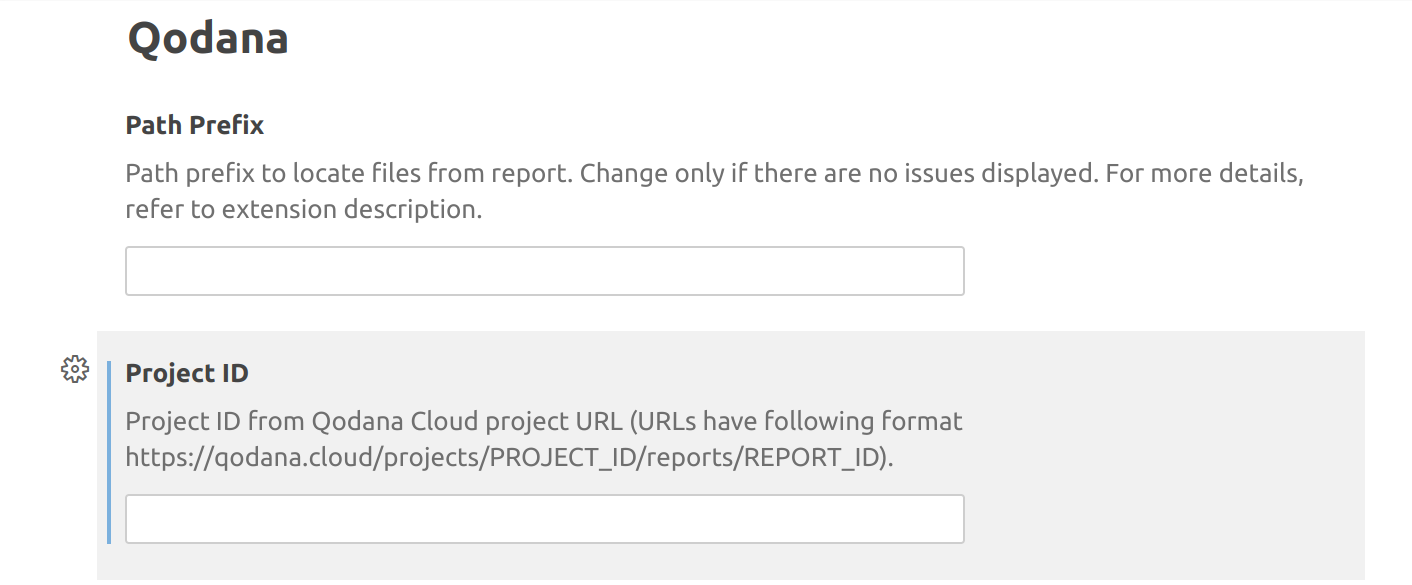
You can configure the extension using the following settings:
Setting | Description | ||||||||||||||||
|---|---|---|---|---|---|---|---|---|---|---|---|---|---|---|---|---|---|
Path Prefix | If necessary, you can override the project path prefix. Here is the rule how the full path to project files is composed: Full Path = Workspace + Path Prefix + Path in a SARIF file Here are examples of how to define the correct path prefix:
In a Qodana Cloud report, you can check with the section to see how the path in a SARIF file is set. Feel free to commit the | ||||||||||||||||
Project ID | You can get the Project ID value by opening the project from the Qodana Cloud report using the button and choosing Visual Studio Code as the tool for opening. Alternatively, the Project ID value is contained in your Qodana Cloud project URL. This URL has the following structure: |
In the status bar of the Visual Studio Code UI, you can find the Qodana icon. This icon can have the following states:
Settings are not valid means that you need to configure the extension. To do it, you can click this icon, which will redirect you to the extension configuration page.
Not attached to report means that you have configured the extension, but the report has not been downloaded yet. To download the report, click the icon.
Attached to report means that the report was downloaded from Qodana Cloud, and now you can view it using Visual Studio Code.
Troubleshooting
I need to switch to another Qodana Cloud account
You can use the Qodana: Reset authentication command to switch between Qodana Cloud accounts without clearing settings. This can be useful in case you have several organizations under different Qodana Cloud accounts.
I cannot get Qodana reports using current settings
You can use the Qodana: Reset all settings command to reset all settings and credentials and try to configure the extension again, or use other settings.