Run and debug R scripts
Click
on the R file toolbar.
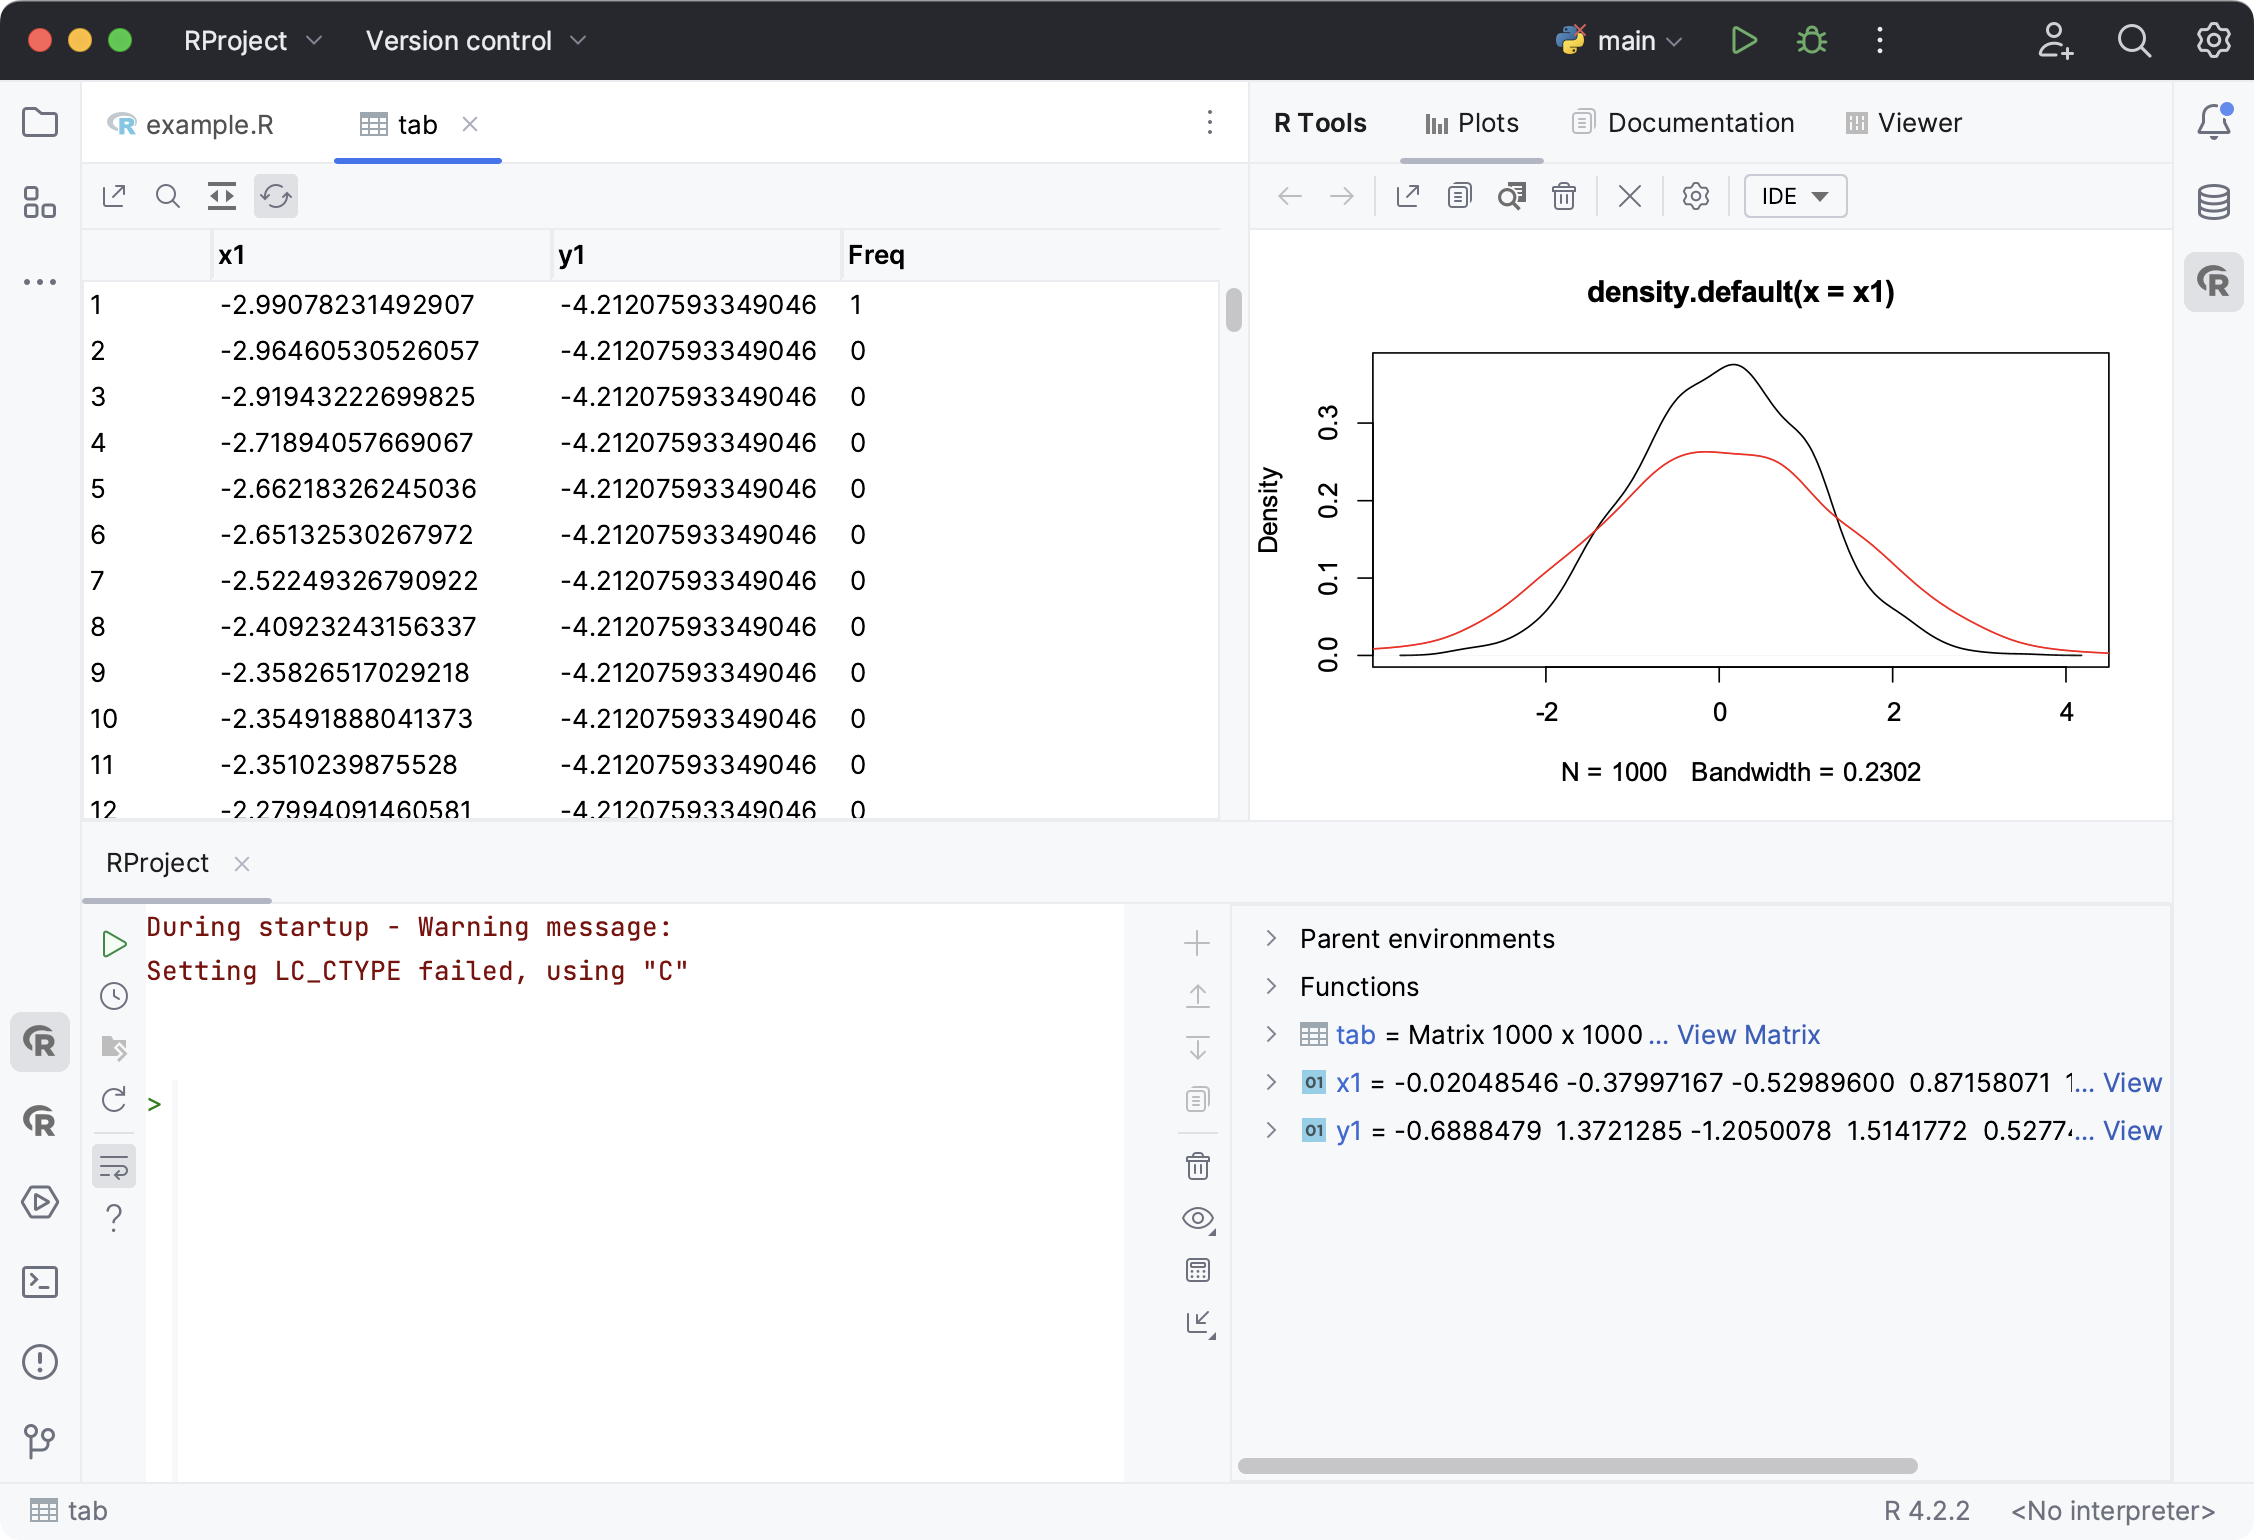
Analyze results in the R console and R Tools windows.
The R console launches and displays the execution results sent to the standard output. PyCharm also opens the Plots tab of the R Tools window if the script renders any visual content.

If the R script involves any JavaScript visualization libraries, the results will be rendered in the Viewer window.
Click
to copy the generated plot in the clipboard. If needed, save the results. Click
in the Plots tab to export the plotted content in a .png file.
You can drag the lower-left corner of of the preview area to adjust the image size. Select Open after saving checkbox if you want to continue processing the image.

Click
in the table view to save the table in a .csv file.
The Variables tab of the R console helps you analyze the values of the variables during script execution. The icon on the left of each variable indicates its type:
: array
: primitive
: object
: table
To preview not only a value of a particular variable but its size and the corresponding class click
on the Variables toolbar to select required options:

Click a View link to preview the array value in the popup and a View Table link to preview data as a table in the editor.

You can filter out the data in the table, structure the table in pages, and define the amount of rows per each page.
Click
on the Variables toolbar to import CSV, TSV, or XLS file. Specify the data set and select the delimiter to preview the data in a tabular form:

The data are added to the global variables and can be accessed from the global environment.

You can execute your R files as a runnable process, job. Jobs are shown in a separate tab in the R console
Open any R file in the editor and click
on the R file toolbar.
Specify the way you want to process the results of the job execution. You can restrict copying it, copy to the global environment, or copy into a separate variable.

The R script is executed and you can track its execution in the Jobs tab of the R console.

Use the following icons of the Jobs toolbar:
Item
Description
Add a new job.
Clear the list of jobs.
Rerun the job.
Switch to the Variables tab of the R console to check the execution results.
Results are in the global environmentResults are in a separate variable

You can debug your R script to detect any errors in the code.
Click the gutter to create breakpoints.
Click
on the R file toolbar.
The debugging process stops at a breakpoint and you can preview the current results in the Variables window.

Control the script execution with the debugging toolbar:
Item
Tooltip and Shortcut
Description
Debug
When the current application is stopped at a breakpoint, click this button to resume execution. When an application is running, this button toggles to
.
Pause Program
Click this button to pause program execution.
Stop
Click this button to terminate the current process.
Step Over
Click this button to execute the program until the next line in the current method or file, skipping the methods referenced at the current execution point (if any). If the current line is the last one in the method, execution steps to the line executed right after this method.
Step Into
Click this button to have the debugger step into the method called at the current execution point.
Step Out
Click this button to have the debugger step out of the current method, to the line executed right after it.
Run to cursor
Click this button to resume program execution and pause until the execution point reaches the line at the current caret location in the editor. No breakpoint is required. Actually, there is a temporary breakpoint set for the current line at the caret, which is removed once program execution is paused. Thus, if the caret is positioned at the line which has already been executed, the program will be just resumed for further execution, because there is no way to roll back to previous breakpoints. This action is especially useful when you have stepped deep into the methods sequence and need to step out of several methods at once.
If there are breakpoints set for the lines that should be executed before bringing you to the specified line, the debugger will pause at the first encountered breakpoint.
Use this action when you need a kind of a temporary breakpoint at a specific line, where program execution should not be interrupted.
View Breakpoints
Click this button to open the Breakpoints dialog where you can configure R breakpoints behavior.

Mute Breakpoints
Use this button to toggle breakpoints status.
When the
button is pressed in the toolbar of the Debug tool window, all the breakpoints in the project are muted, and their icons become grey:
 .
.You can temporarily mute all the breakpoints in a project to execute the program without stopping at breakpoints.
Evaluate Expression
Click this button to open the Evaluate Expression dialog.
To execute or debug a code fragment, select the fragment and press ![]() or
or ![]() . When running code fragments, mind code dependencies. All variables used in the executed fragments must be initialized.
. When running code fragments, mind code dependencies. All variables used in the executed fragments must be initialized.
With run/debug configurations, you can define the way PyCharm executes your R code.
Do one of the following:
Go to Run | Edit Configurations.
In the main toolbar, select Edit Configurations from the list of run/debug configurations.

Press and select the Edit Configurations.
In the Run/Debug Configurations dialog, click + on the window toolbar and select the R configuration from the list of the available run/debug configurations.

Specify the location of the script and its working directory. You can also define the command-line arguments of the R script to be executed and options of the R interpreter. The list of the environmental variables contains several variables that are delimited with semicolons. To fill in the list, click the browse button and specify the desired set of environment variables in the Environment Variables dialog.
If you want to execute any task before the R script, click + nearby the Before launch field and select a task. For example, you can request for opening a browser before executing your Shiny code.
When done, click Ok to save the configuration. Now, you can click
 to run it.
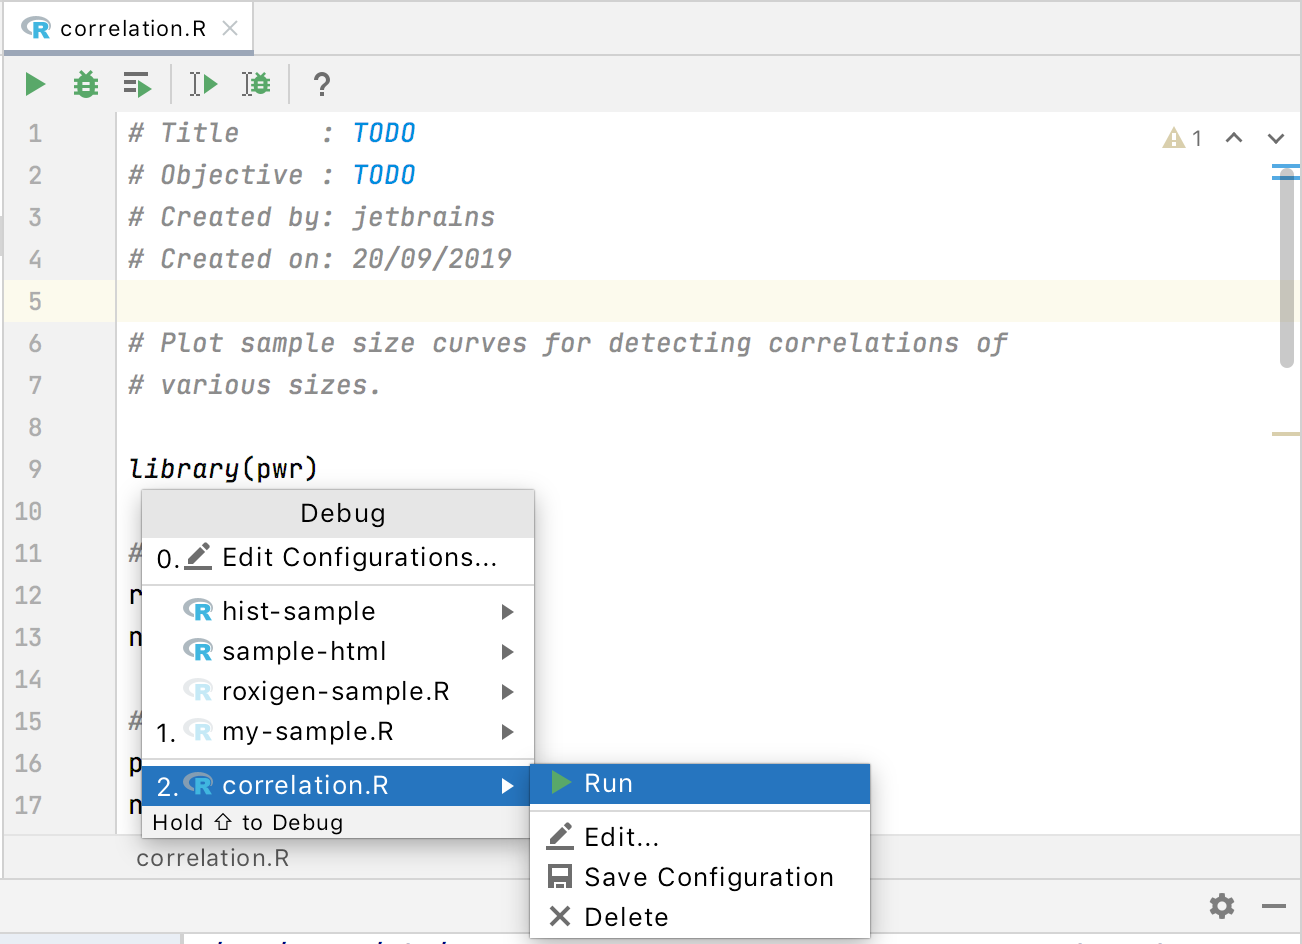
You can create a temporary run/debug configuration for a script and later add more parameter to it. Open an R file in the editor, right-click any place in the editor, and press .
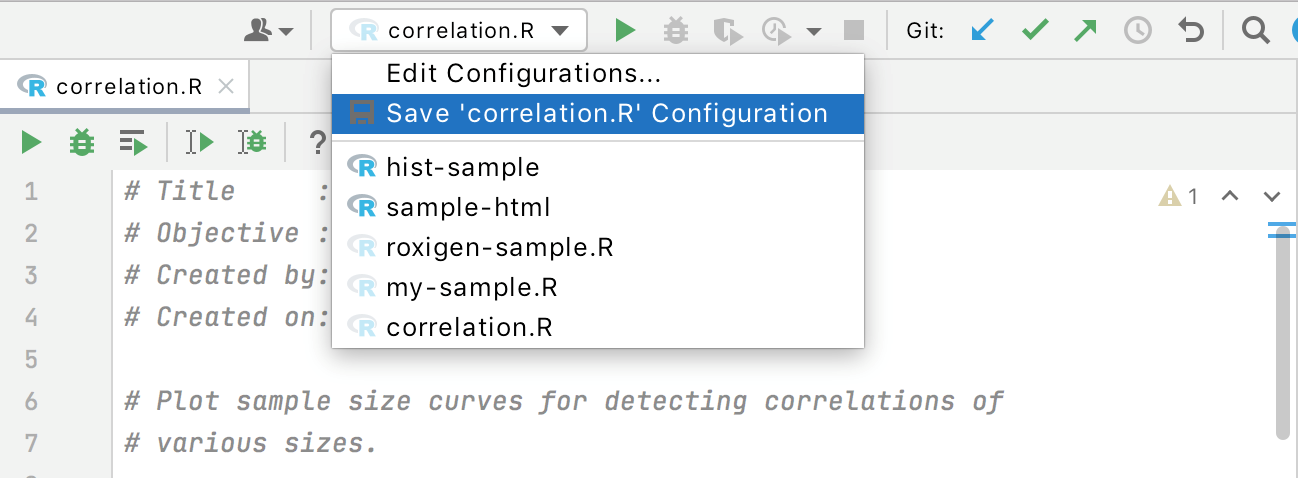
PyCharm creates a temporary configuration, so that you can edit or run it.

Temporary configurations appear in the list of the created configurations. At any time you can modify a temporary configuraion and save it (so it becomes permanent).
