Hadoop YARN
Available only in PyCharm Professional: download to try or compare editions
With PyCharm, you can monitor your Hadoop YARN metrics.
note
This functionality relies on the Metastore Core plugin, which is installed automatically if you install the Spark or the Flink plugin.
Typical workflow:
In the Big Data Tools window, click
and select Hadoop YARN.
In the Big Data Tools dialog that opens, specify the connection parameters:

Name: the name of the connection to distinguish it between the other connections.
URL: the URL of the Hadoop server.
Optionally, you can set up:
Per project: select to enable these connection settings only for the current project. Deselect it if you want this connection to be visible in other projects.
Enable connection: deselect if you want to disable this connection. By default, the newly created connections are enabled.
Enable tunneling. This option creates an SSH tunnel to the remote host. It can be useful if the target server is in a private network but an SSH connection to the host in the network is available.
Select the checkbox and specify a configuration of an SSH connection (click ... to create a new SSH configuration).
Enable HTTP basic authentication: connection with the HTTP authentication using the specified username and password.
Proxy: select if you want to use IDE proxy settings or if you want to specify custom proxy settings.
You can also reuse any of the existing Spark connections. Just select it from the Spark Monitoring list.
Once you fill in the settings, click Test connection to ensure that all configuration parameters are correct. Then click OK.
At any time, you can open the connection settings in one of the following ways:
Go to the Tools | Big Data Tools page of the IDE settings CtrlAlt0S.
Click
on the Hadoop YARN tool window toolbar.
Once you have established a connection to the Hadoop server, the Hadoop YARN tool window appears. It consists of the several areas to monitor data for:
The detailed information about the cluster metrics and resources powered by the Resource Manager.

Presents information about the nodes responsible for tasks execution.

Provides the detailed information about the selected data node, including node resource allocation.

The detailed overview of the users' applications, including application metrics and execution attempts.

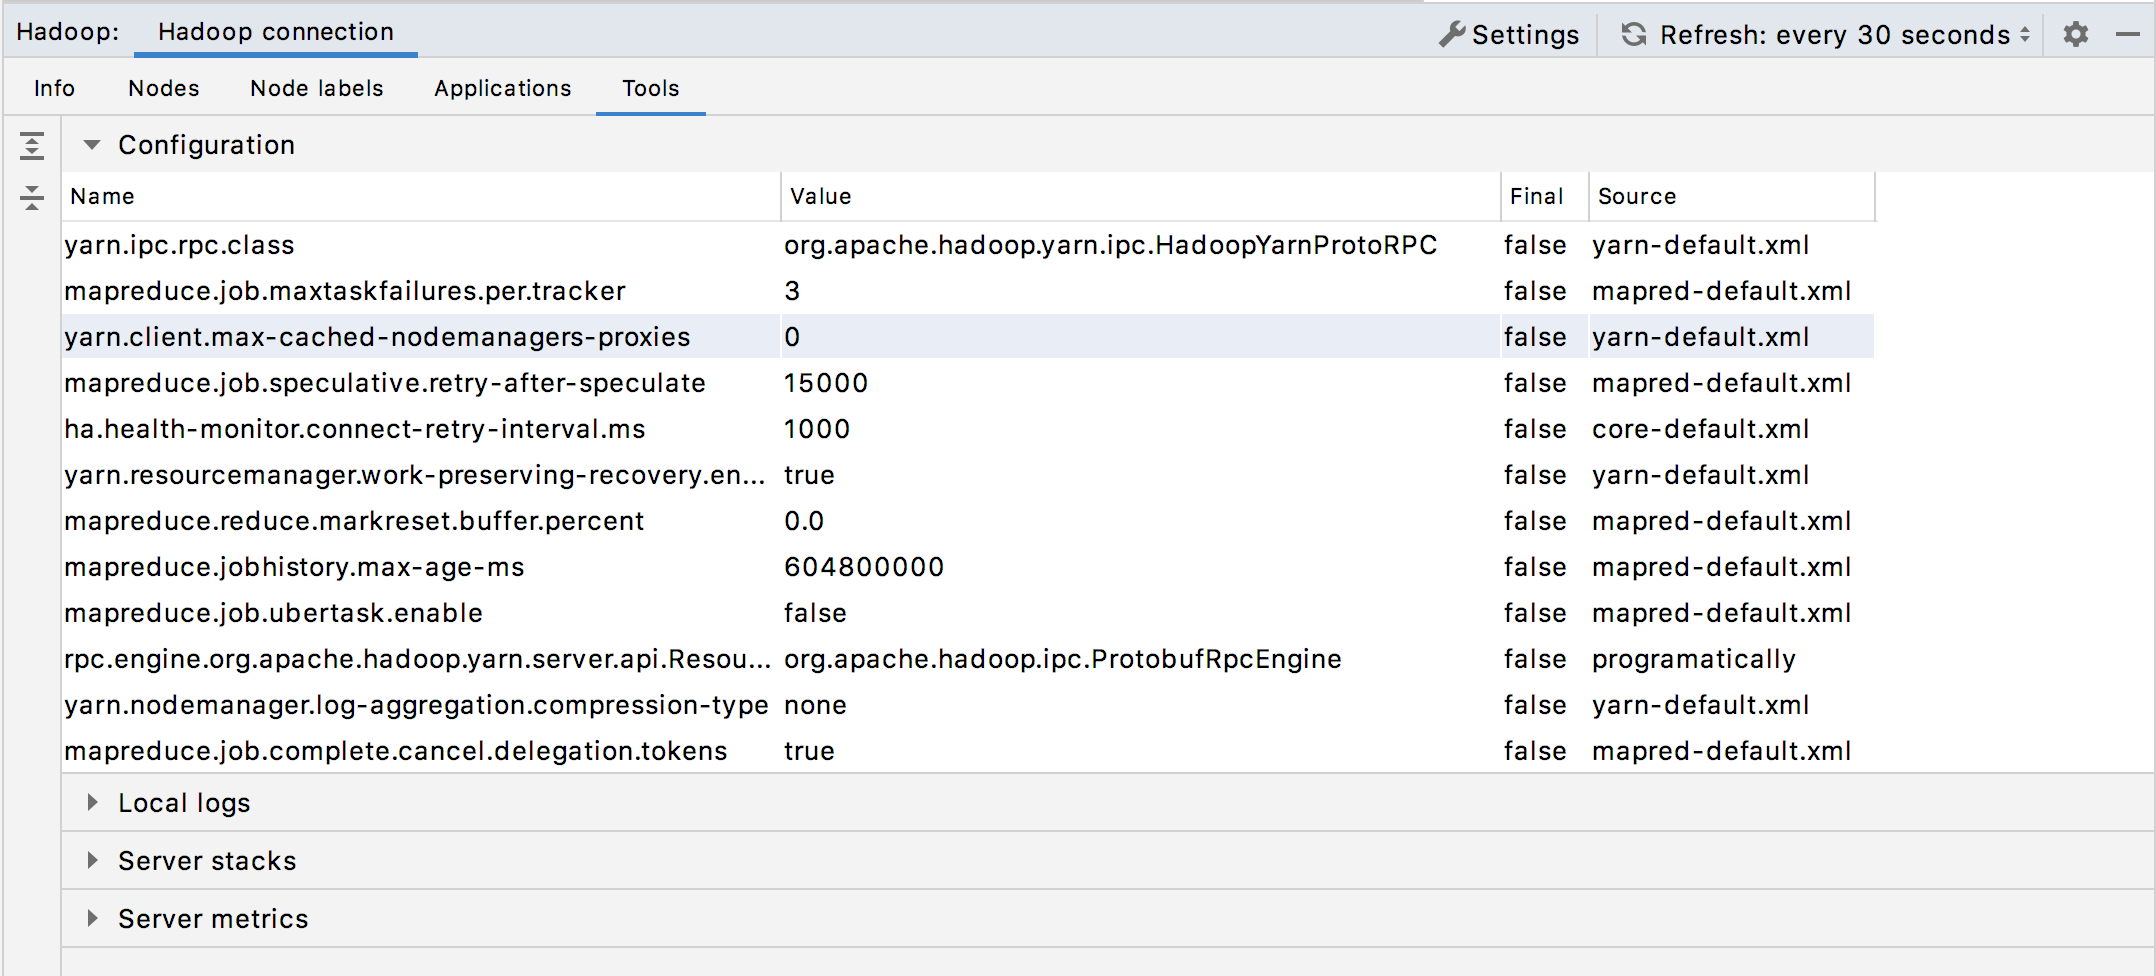
Monitoring tools, such as connection settings, log information, server stacks details, and server metrics.

For more information about types of data, refer to Hadoop documentation.
In the list of the applications, select one to study.
To manage visibility of the monitoring areas, use the following buttons:
Item
Description
Shows the list of execution attempts.
Shows application details.

To focus on a particular application, click the Open in a separate tab link in the Application details monitoring area.

The application details will be shown in a separate tab.

Click
to preview any monitoring data in a browser.
Once you have set up the layout of the monitoring window, opened or closed some preview areas, you can filter the monitoring data to preview particular parameters.
Use the filter button (
) in the monitoring tabs to show details for applications with specific status. Select the specific application statuses you want to monitor.
You can also filter the list of applications by a username, start time, and end time. Besides, you can specify the limit of the items in the filtered list.

Manage content within a table:
Click a column header to change the order of data in the column.
Click Show/Hide columns on the toolbar to select the columns to be shown in the table:

At any time, you can click on the Hadoop YARN tool window to manually refresh the monitoring data. Alternatively, you can configure the automatic update within a certain time interval in the list located next to the Refresh button. You can select 5, 10, or 30 seconds.