Code Running Assistance
You have already created a Python project and populated it with the following code:
import math


def demo(a, b, c):
    d = b ** 2 - 4 * a * c
    if d > 0:
        disc = math.sqrt(d)
        root1 = (-b + disc) / (2 * a)
        root2 = (-b - disc) / (2 * a)
        return root1, root2
    elif d == 0:
        return -b / (2 * a)
    else:
        return "This equation has no roots"


class Solver:
    pass


if __name__ == '__main__':
    solver = Solver()
    a = int(input("a: "))
    b = int(input("b: "))
    c = int(input("c: "))
    result = demo(a, b, c)
    print(result)
You have Python interpreter already configured. Note that for the current project your Python interpreter version should be 3.0 or later.
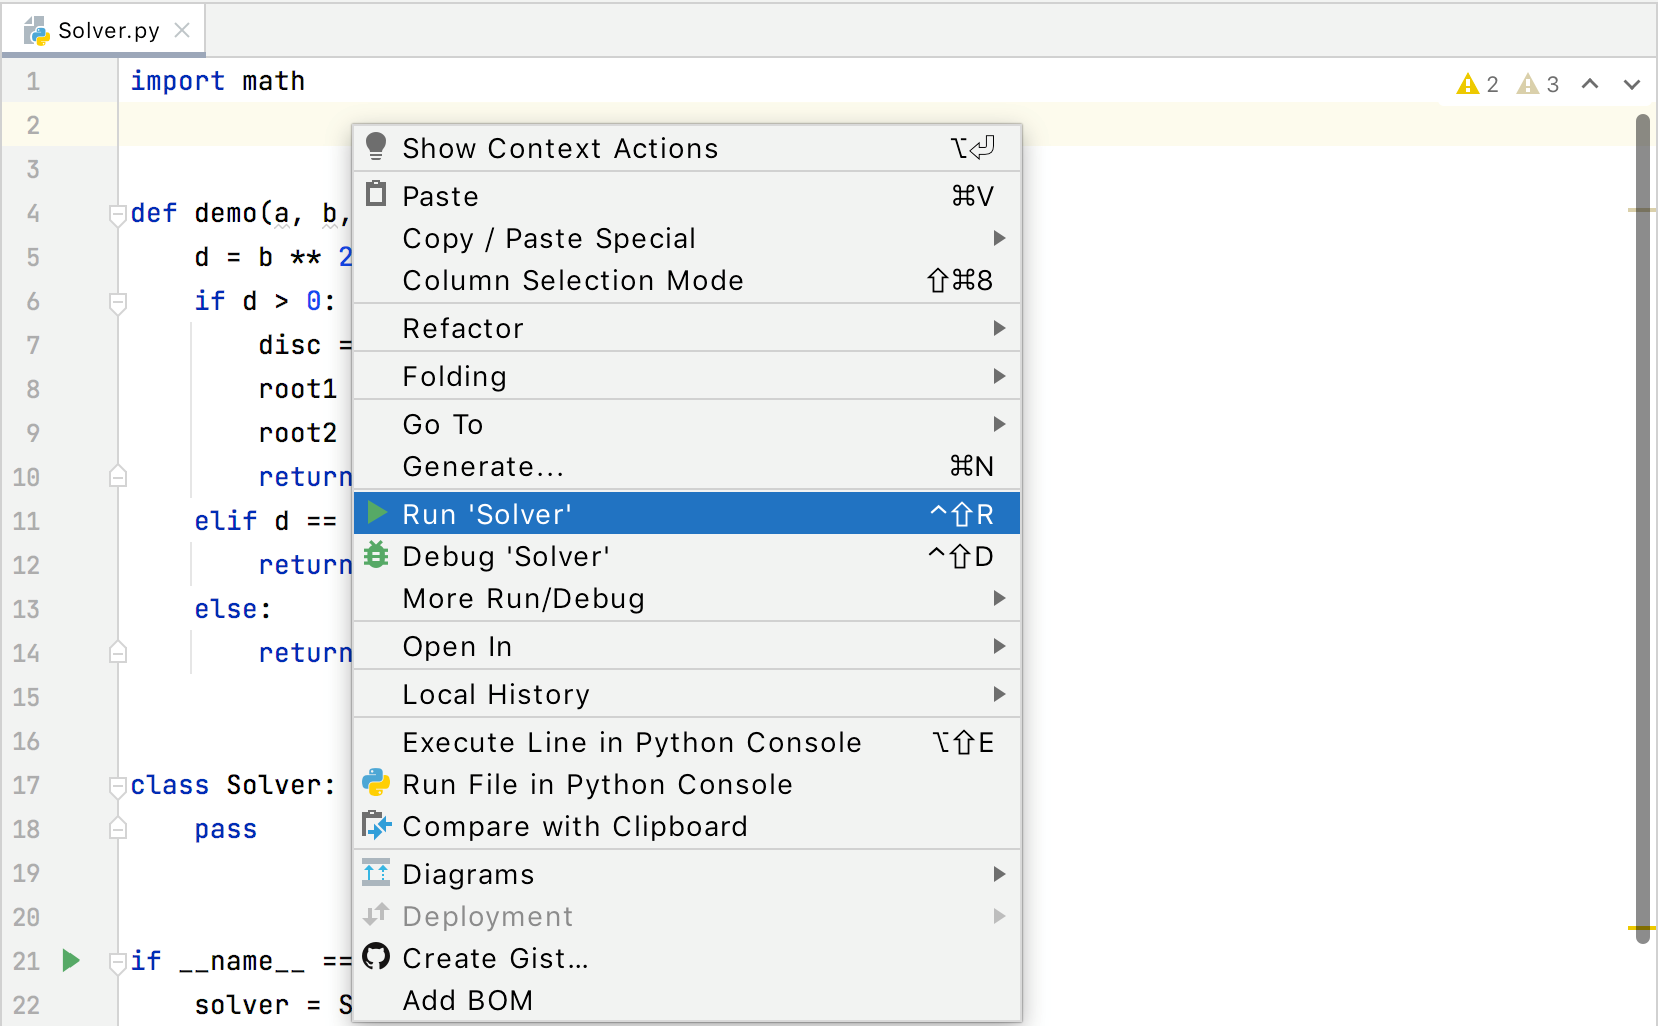
Open the class Solver.py for editing , and right-click the editor background. Then choose Run 'Solver' from the context menu:
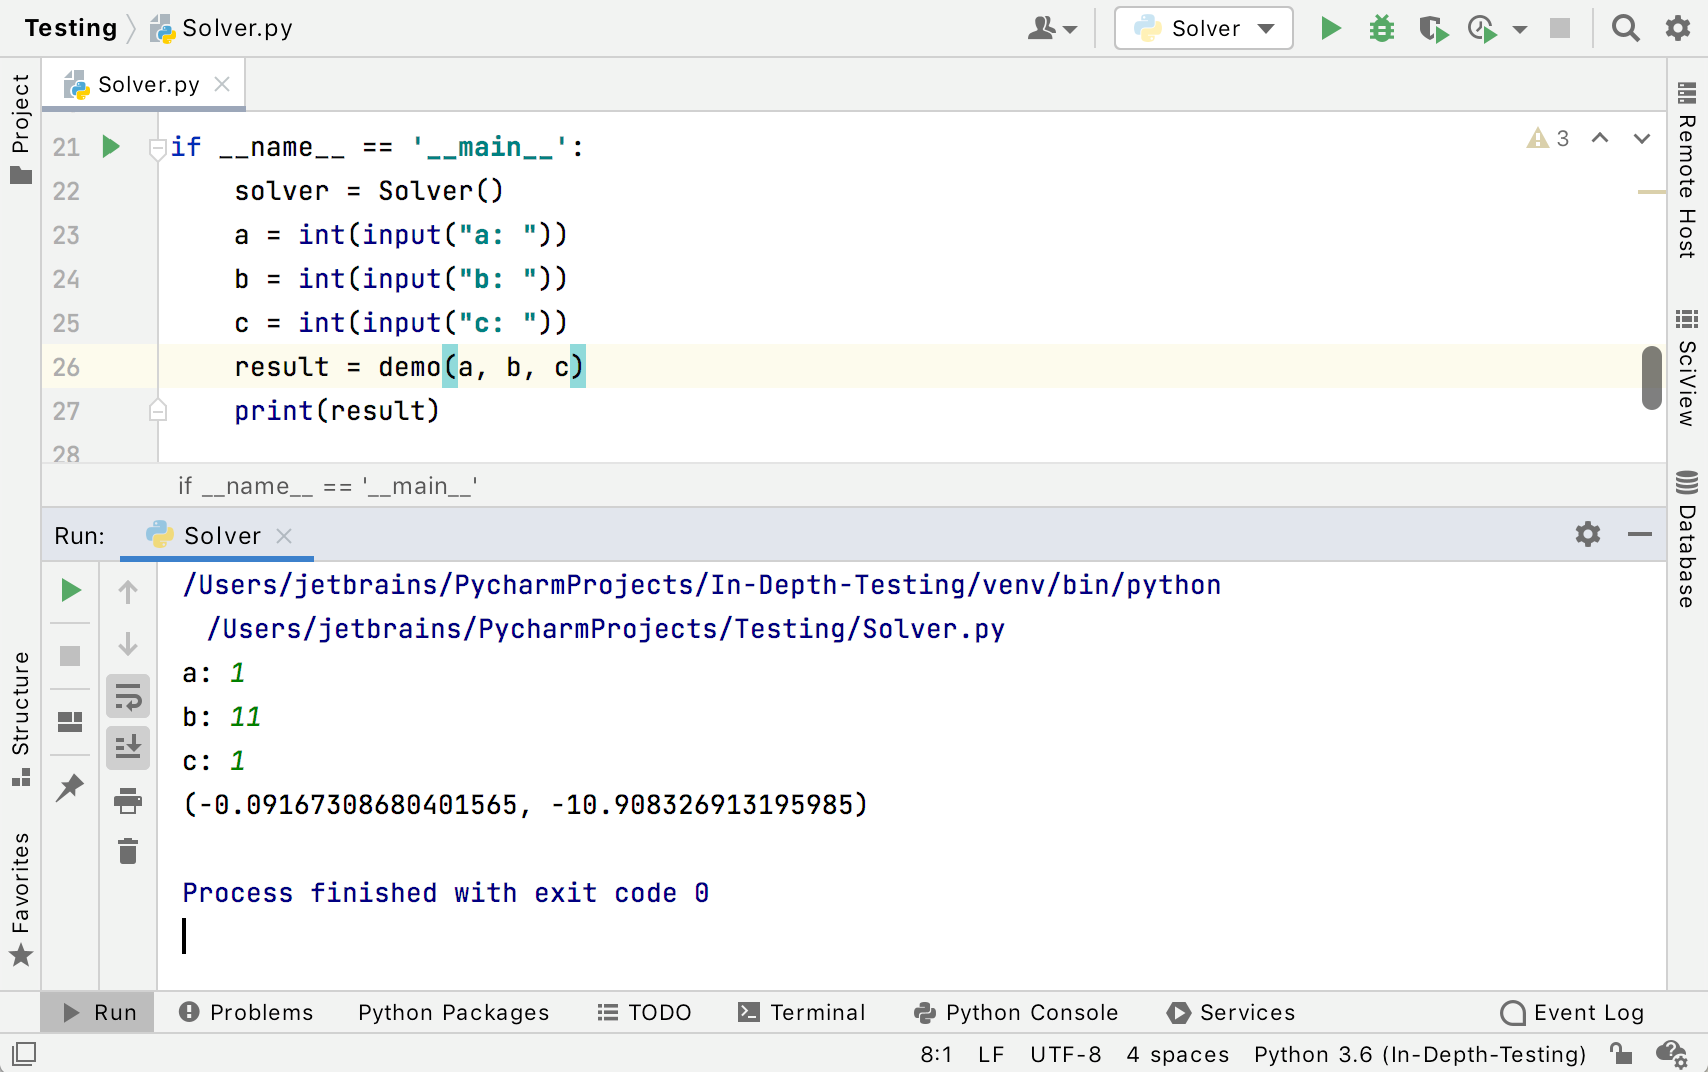
The script runs. Enter values for a, b, and c to review the output in the Run tool window:
Let's explore in detail what we've done and what we see.
Each script or test you wish to run or debug from within PyCharm, needs a special profile that specifies the script name, working directory, and other important data required for running or debugging. PyCharm comes with a number of such pre-defined profiles, or run/debug configurations, that serve patterns, against which you can create any number of run/debug configurations of your own.
Every time you click the Run or Debug buttons (or choose Run or Debug commands from the context menu), you actually launch the current run/debug configuration in the run or debug mode.
If you look at the very first image, you will notice that in the combobox there is no run/debug configuration at all; on the second image it appears, marked with the green circle. It means that the Solver run/debug configuration has been created automatically by PyCharm, when you've chosen Run 'Solver' from the context menu. Now, as this run/debug configuration is marked with the green circle, it is current.
Look at the main toolbar on the second image: the current run/debug configuration is visible in the combobox. To its right you see the buttons ,
,
,
![]() ,
, ; the run/debug configuration in the combobox is Solver.
You also see that its icon is shown semi-transparent. What does it mean? It means that the Solver run/debug configuration is temporary - PyCharm has created it automatically.
OK, now click the down arrow to reveal the available commands and, below the separator line, the list of existing run/debug configurations:

Should you have more run/debug configurations, the list of existing ones will become broader. If you click one of the run/debug configurations in this list, it will become current.
Choose this command to save the temporary run/debug configuration 'Solver' - now this configuration becomes permanent. As such, it gets the normal icon.
This command is first in the list. Choose Edit configurations, and see the Run/Debug Configurations dialog opens:
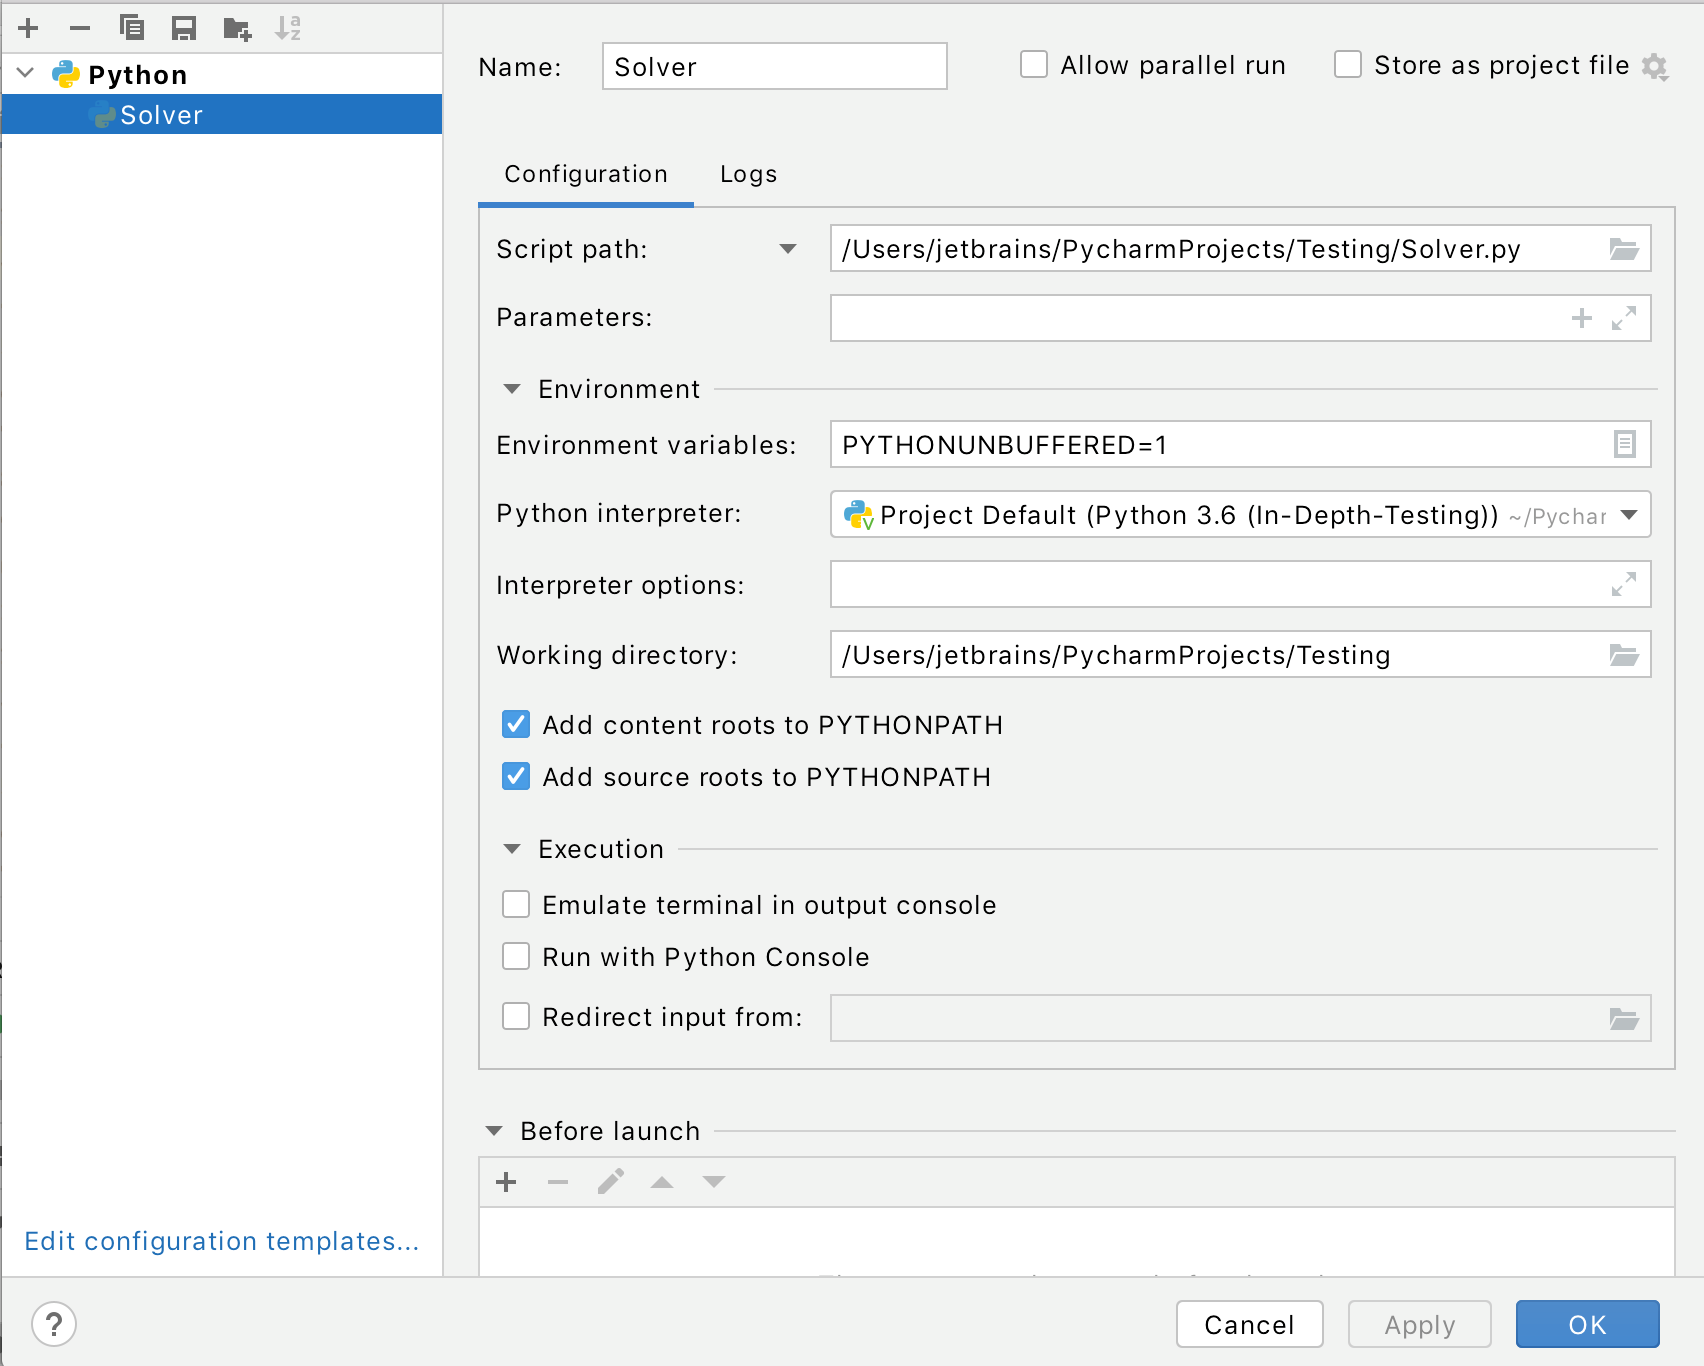
Here you can see the Solver configuration and its default settings.
The default configuration options are derived from the predefined Python template. Click the Edit configuration templates link, to preview and modify the patterns.
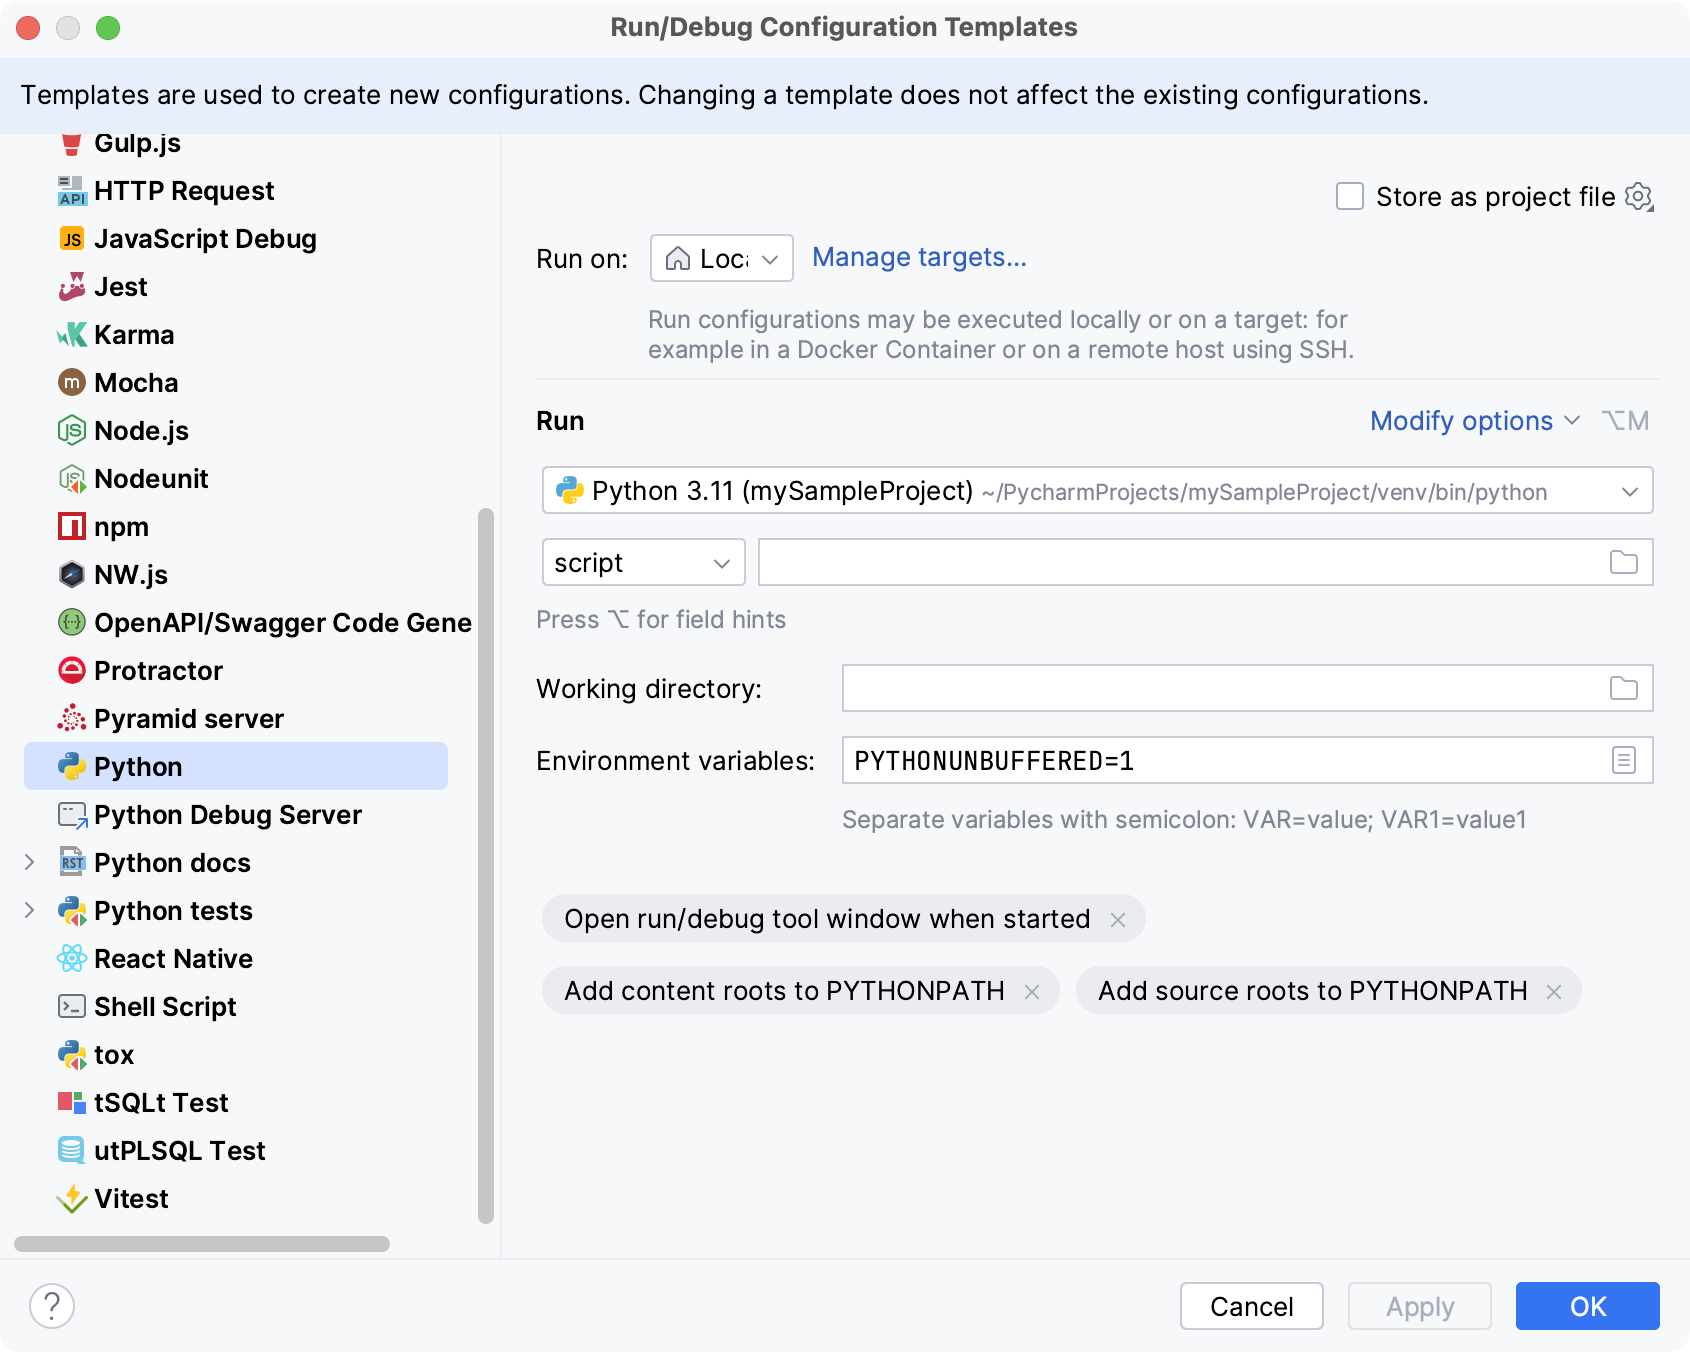
For example, you want to change the Python interpreter to use a remote or other local interpreter. OK, select the interpreter of your choice in the Python page – then any newly created run/debug configuration of the Python type will use this interpreter.
Under the Python node, you see the only run/debug configuration Solver. It belongs to the Python type, and is created against the pattern Python. It is denoted with the icon of the normal opacity – which corresponds to the permanent run/debug configuration (remember, it became permanent because you've saved it – however, any specially created run/debug configuration also becomes permanent). As an example, create a new run/debug configuration of the Python type for the same Solver script, and call it 'Solver1'.
If you change anything in one of the existing run/debug configurations, then only this particular run/debug configuration will be affected.
You can use the Run/Debug Configuration dialog to automatically submit input values from a text file instead of typing them in the Run tool window.
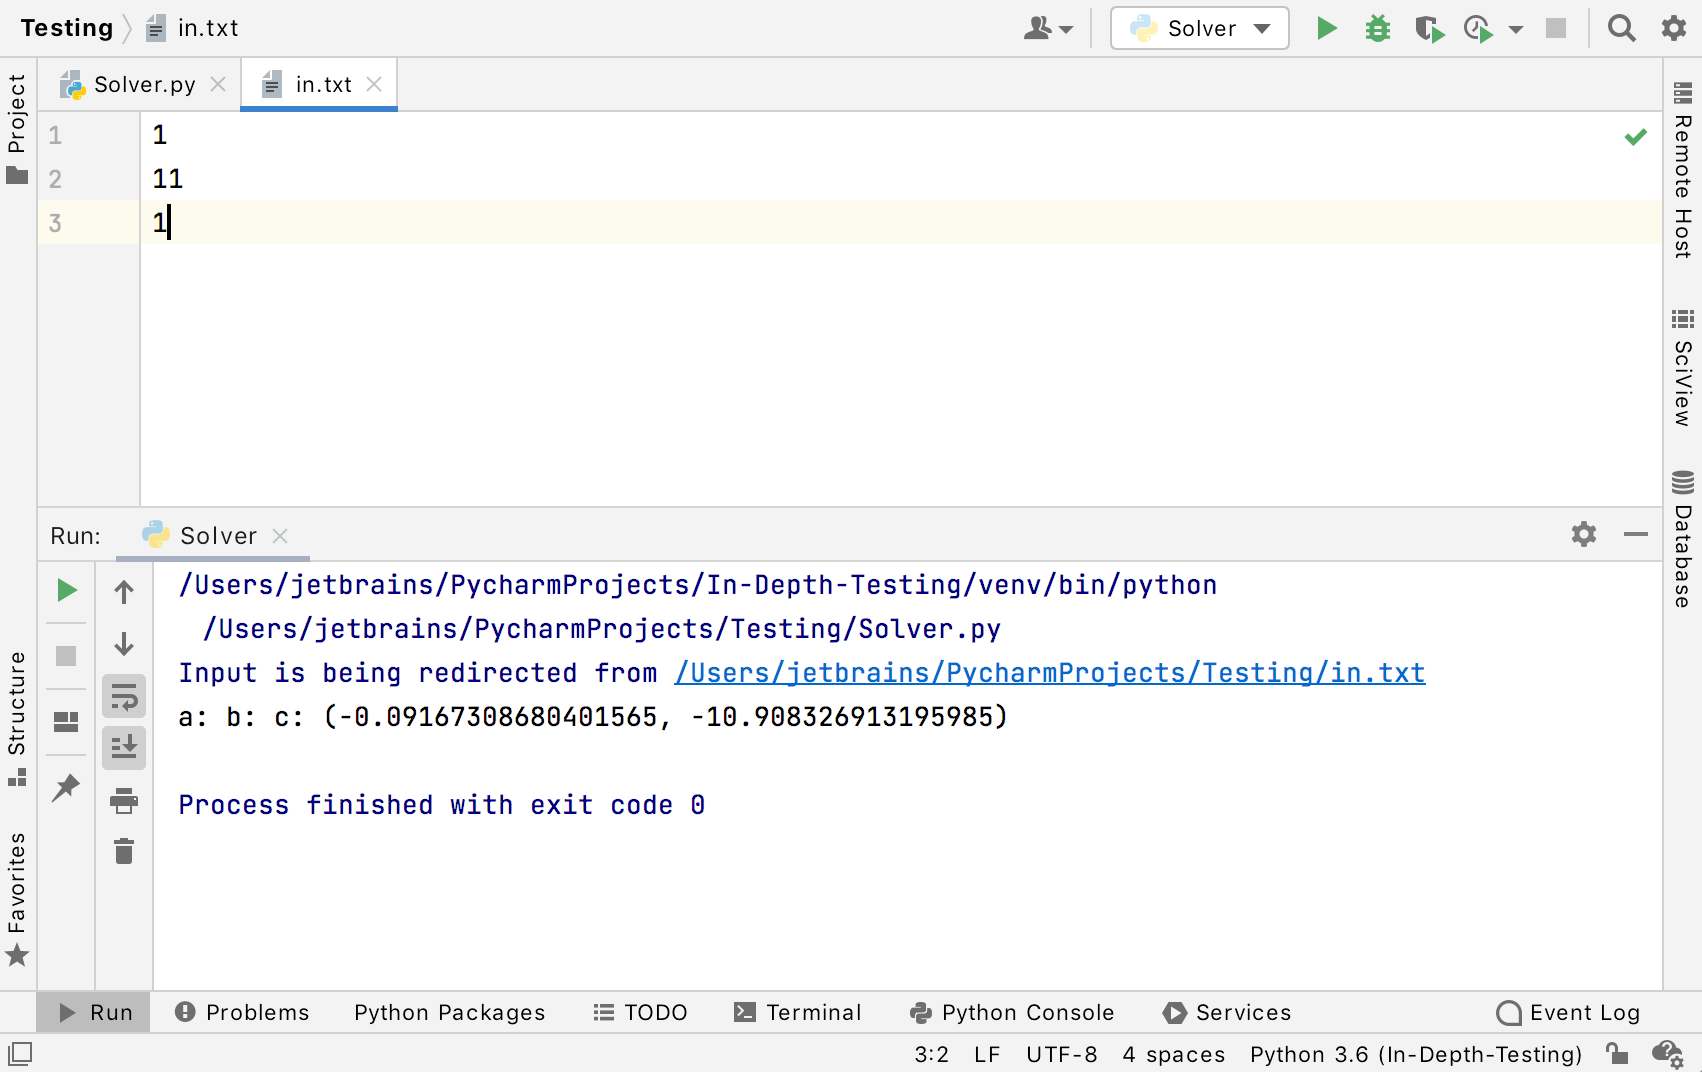
Create the in.txt file with the following values of a, b, and c:
1
11
1
To enable redirecting, select the Redirect input from checkbox and specify the path to the in.txt file.
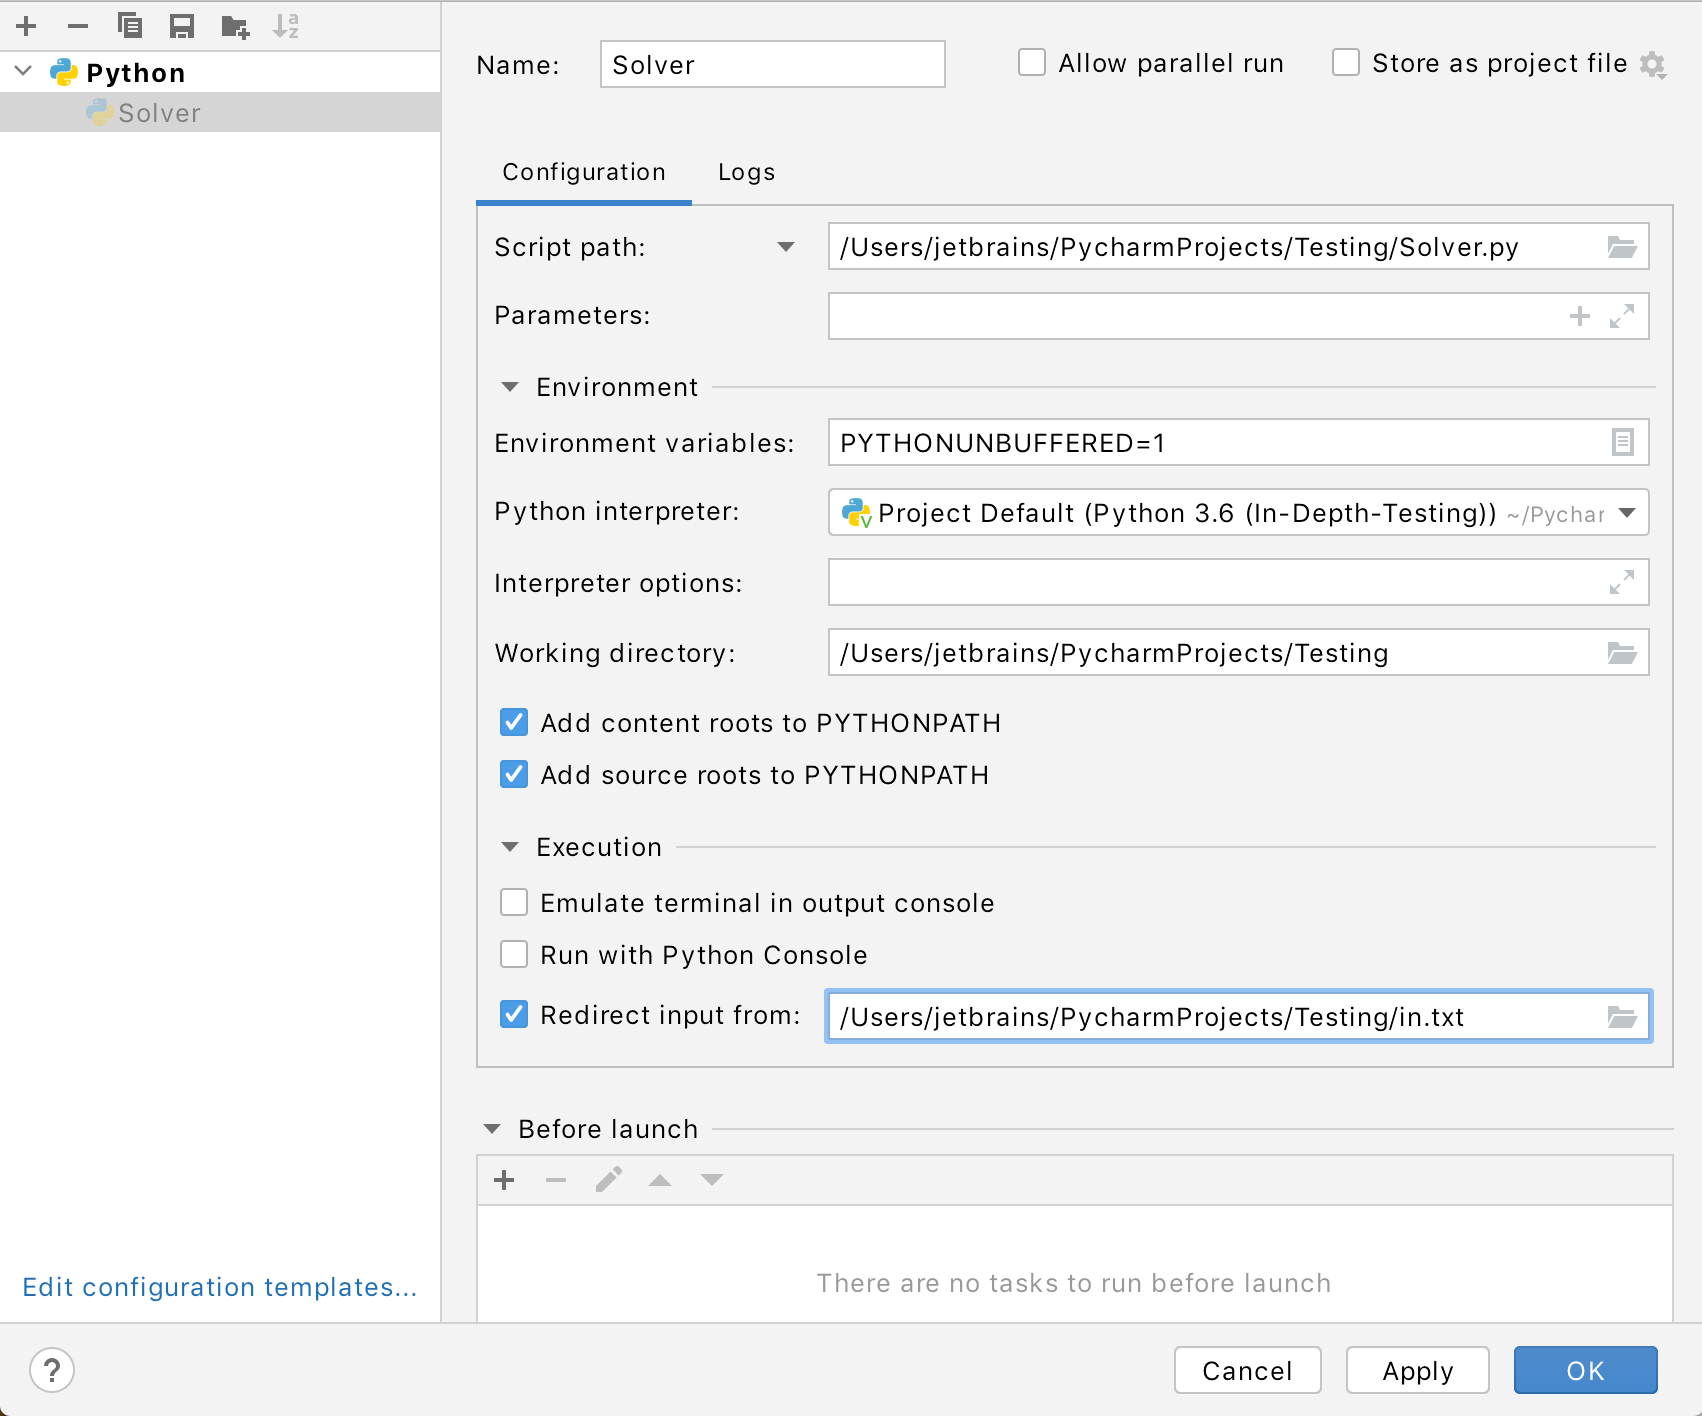
Save the Run/Debug configuration and run it. Preview the execution results in the Run tool window.
When running your Python scripts, you can pass various values as command-line arguments. Use the Parameter field in the Python run/debug configuration to add a parameter or to insert a macro.
Modify the code sample so that it can use a command-line argument value instead of "4" in the calculations.
import math
import sys


def demo(a, b, c):
    n = float(sys.argv[1])
    d = b ** 2 - n * a * c
    if d > 0:
        disc = math.sqrt(d)
        root1 = (-b + disc) / (2 * a)
        root2 = (-b - disc) / (2 * a)
        return root1, root2
    elif d == 0:
        return -b / (2 * a)
    else:
        return "This equation has no roots"


class Solver:
    pass


if __name__ == '__main__':
    solver = Solver()
    a = int(input("a: "))
    b = int(input("b: "))
    c = int(input("c: "))
    result = demo(a, b, c)
    print(result)
Open the
Solverrun/debug configuration.In the Run/Debug Configurations dialog, select Solver from the list of the Python run/debug configurations. Then, click + in the Parameters field and select ClipboadContent from the list of the available macros.

In this example, the clipboard contains the value 76 and it is shown in the Macro preview area.
Click Insert to add the selected macro.
Run the Solver run/debug configuration. Note that the command line now contains "76" as an argument.

Copy any numeric value into the clipboard and rerun the configuration to evaluate the macro.
Similarly, you can include other helpful macros:
$FilePath$: for the file path of the open file$ModuleSdkPath$: for the project interpreter path$Prompt$: for a string input dialog on running the configuration
You've already executed the Solver script in one of the most straight-forward ways. let's now explore the other ways to run a script.
As you have already learnt, running a script means in fact launching the current run/debug configuration. So, to run the Solver script, follow this procedure:
On the main toolbar, click the run/debug configuration combobox, and make sure that 'Solver' run/debug configuration is the current one.
Do one of the following:
Click the Run button
, located next to the run/debug configuration combobox.
Press .
Go to Run | Run.
Now you can observe results in the Run tool window.
We won't discuss here why testing is necessary – let's assume that it is so, and discuss how PyCharm can help with it.
First, choose the test runner. To do that, click on the main toolbar to open the Settings dialog, and under the Tools node, click Python Integrated Tools page. Here is where you will select the default test runner:
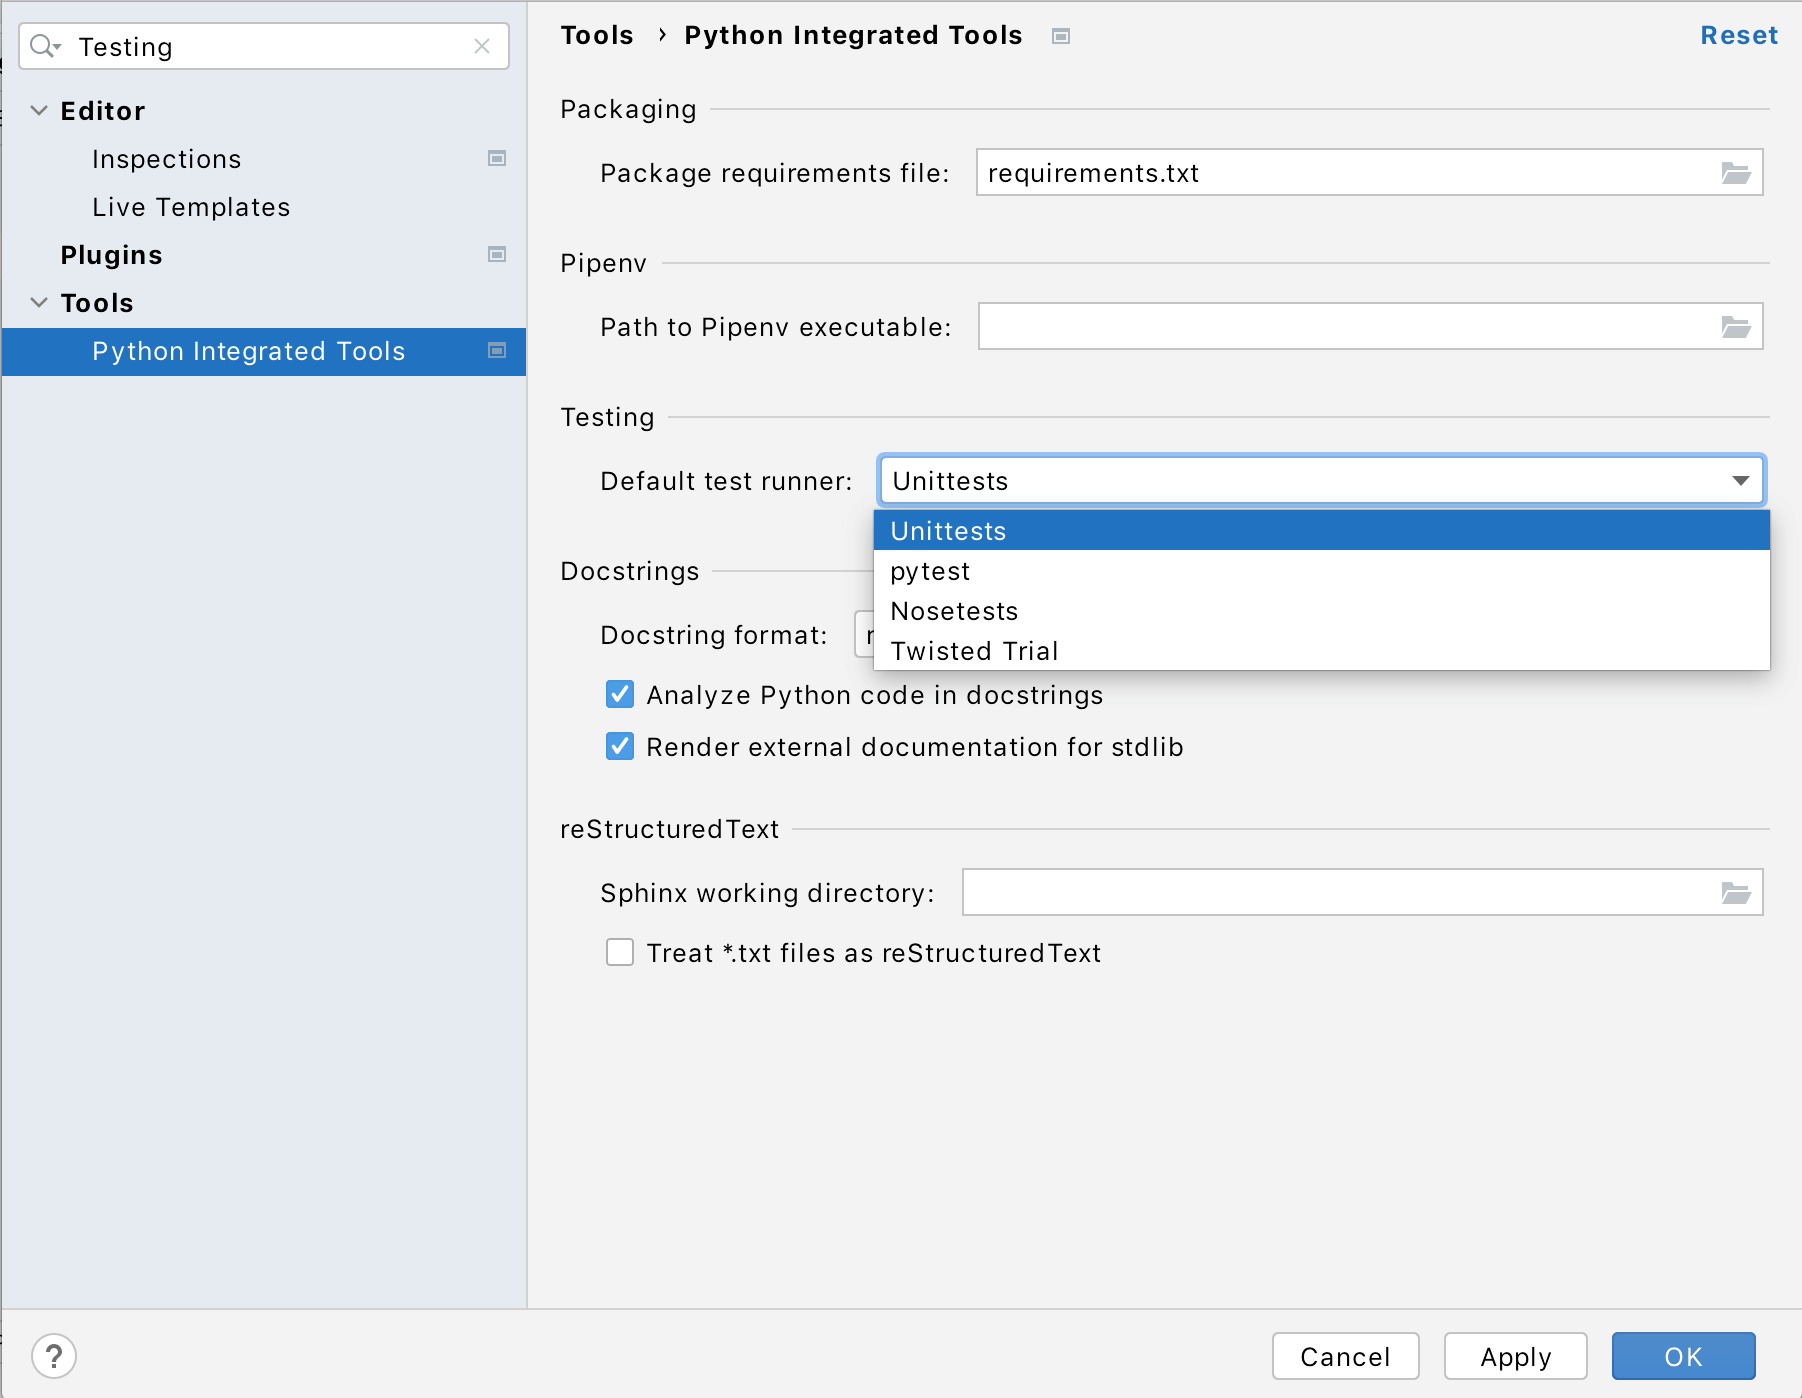
In this case, this is Unittests. Apply changes and close the dialog.
To run a test, you have to create it first. PyCharm suggests a smart way to stub a test out: click the class name and then press , or go to Navigate | Test. If a test exists, you can jump directly to it; if it doesn't, PyCharm will create it:
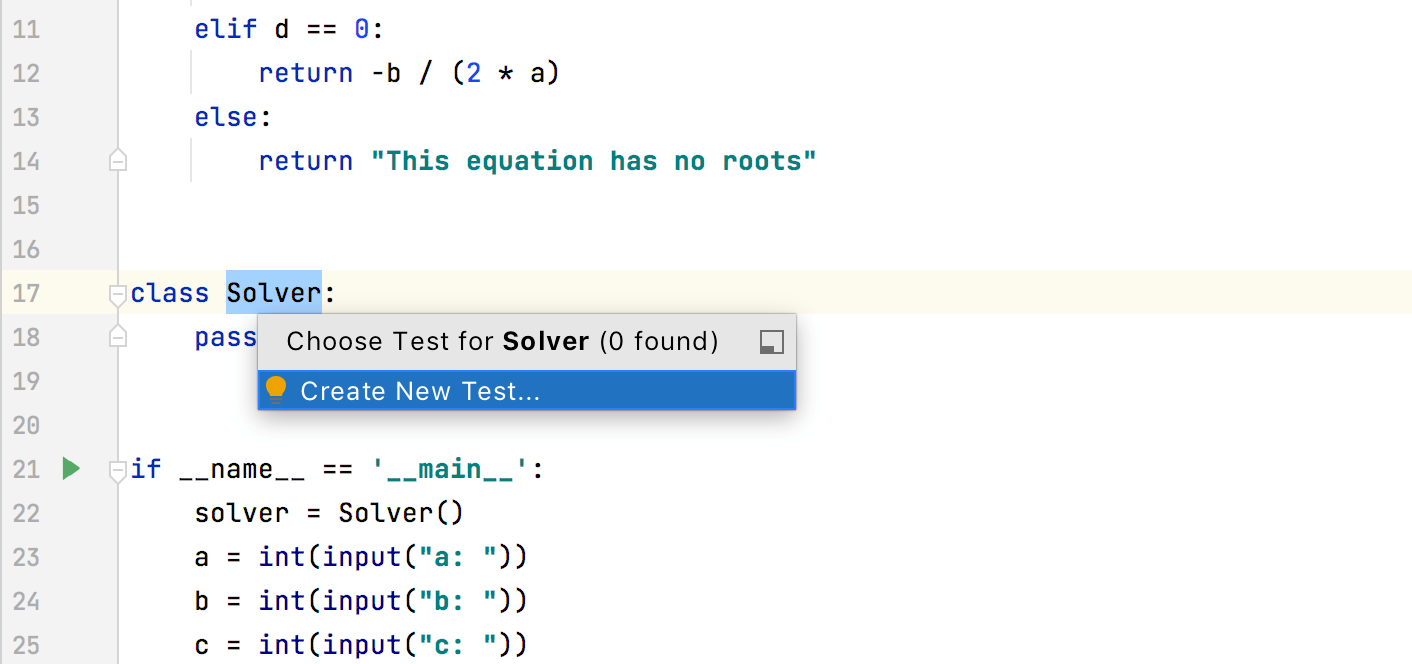
Click the suggested action, and PyCharm will show the following dialog:
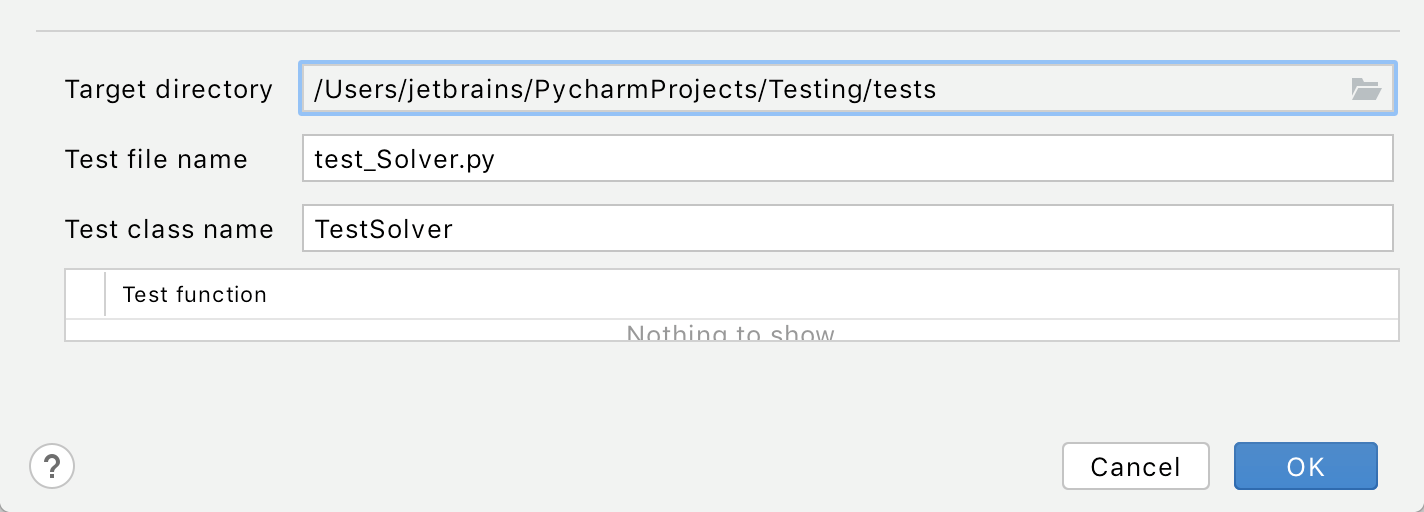
Click OK, and see the test class opened in the editor:
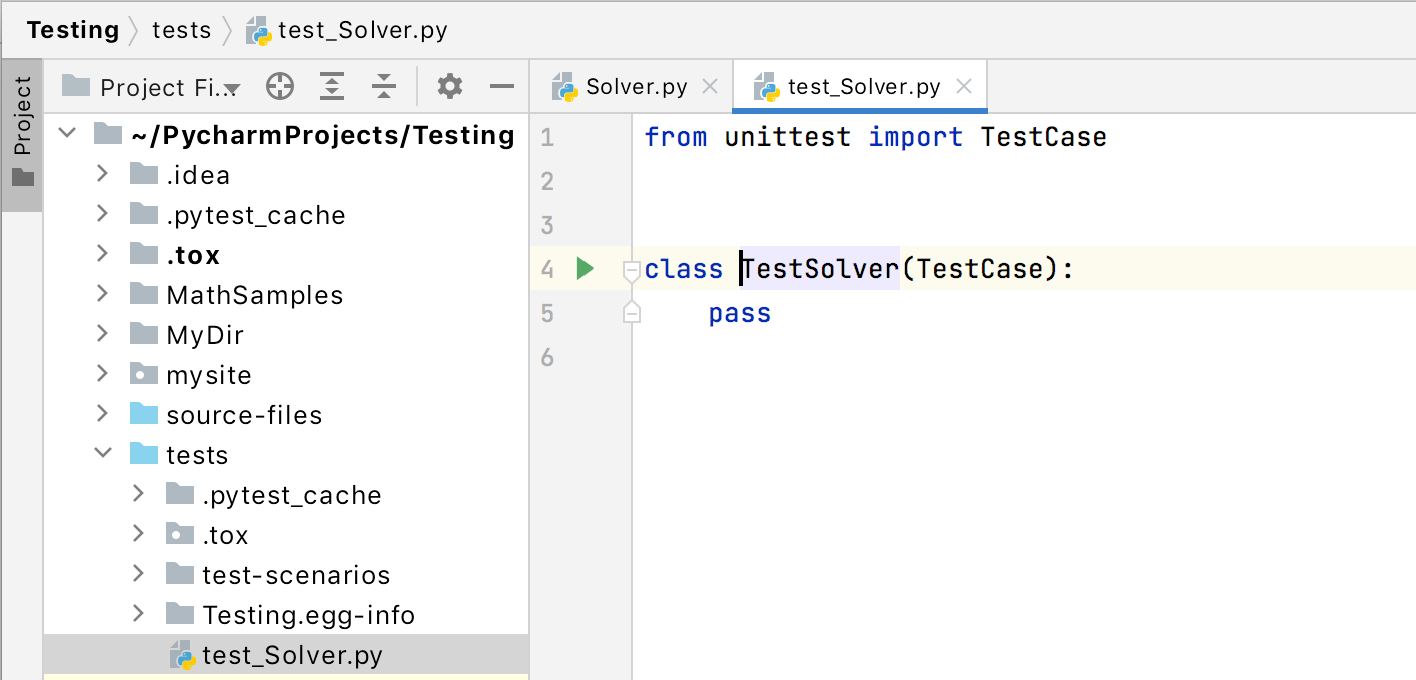
PyCharm has produced a test class for us. However, this is but a stub, and lacks the actual testing functionality. So, we will import the class to be tested, and add a test method. The resulting code might be as follows:
import unittest

from Solver import Solver


class MyTestCase(unittest.TestCase):

    def test_negative_discr(self):

        s = Solver()

        self.assertRaises(Exception)

    def test_something(self):

        self.assertEqual(True, False)


if __name__ == '__main__':

    unittest.main()
tip
if you have a project directory structure, you will need to reflect that in the auto-completion of your import statement (from Solver import Solver).
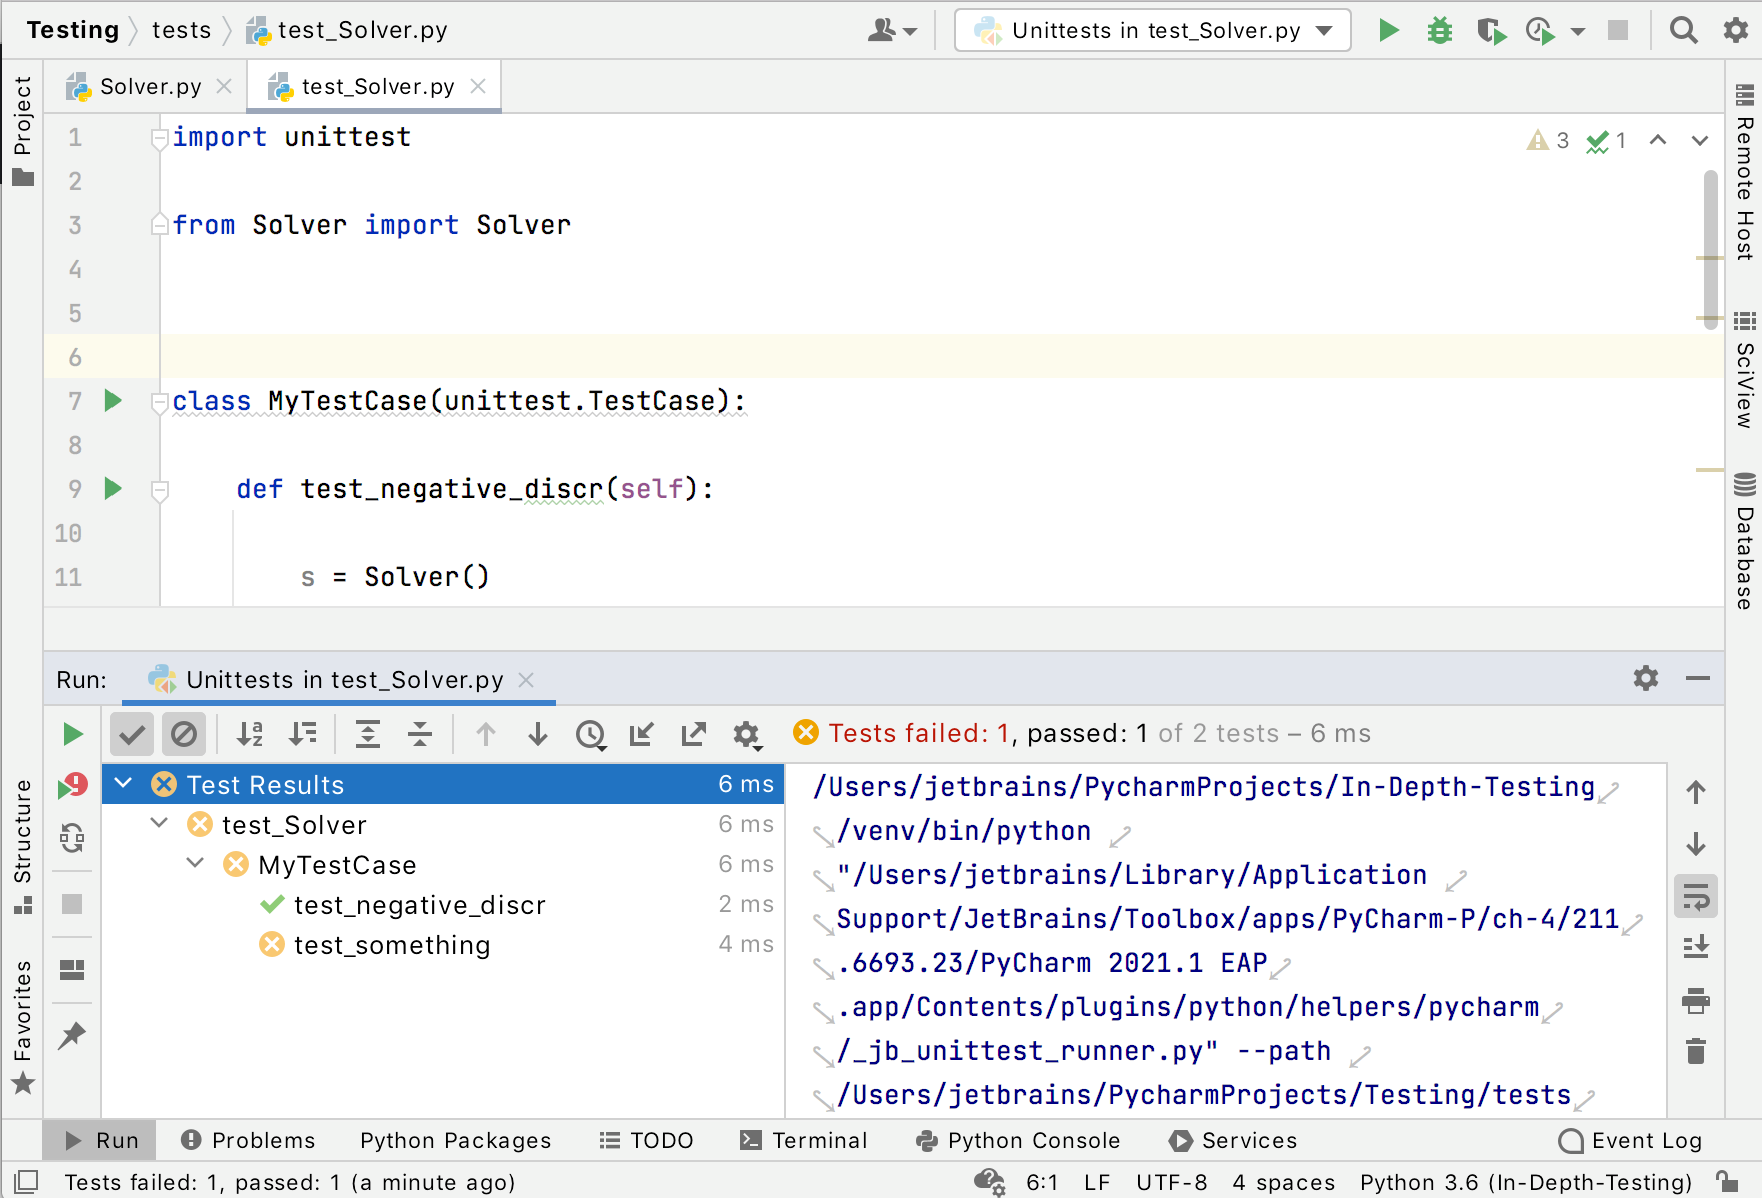
When ready with the testing code, right-click the test class name - the Run node of the context menu shows Unittests run/debug configuration.
Launch it and observe results in the Test Runner tab of the Run tool window:
First of all, why do we need debugging? Suppose, you hit a runtime error. How to find out its origin? This is where debugging is necessary.
With PyCharm, you can debug your applications without leaving the IDE. The only thing you need to do beforehand is to place breakpoints in the required places. Let's explore this in details.
A breakpoint is a line of the source code, where PyCharm will suspend, when this line is reached. PyCharm discerns several types of breakpoints, each one denoted with its own icon.
Here we'll use the Python line breakpoints.
This is definitely the easiest part of the process. Just click the gutter on the lines you want to explore – and the breakpoints are there:
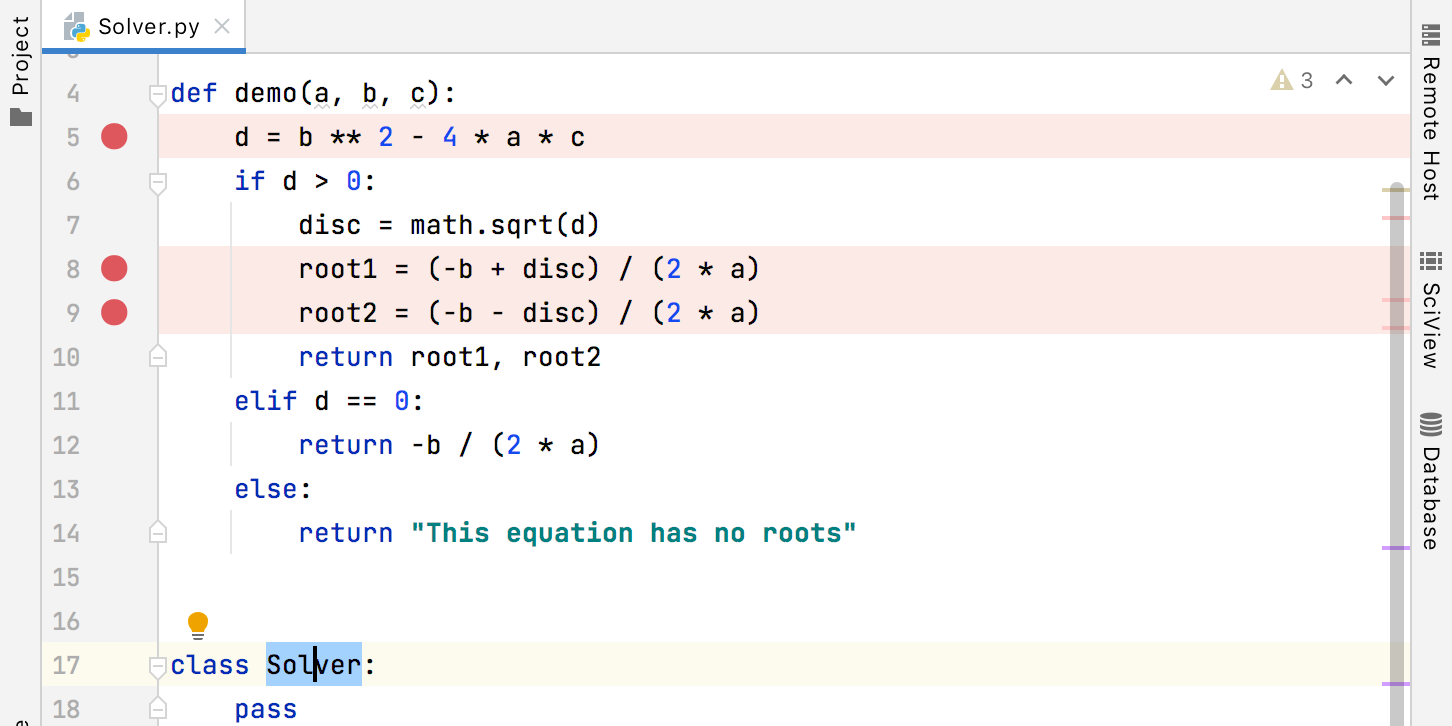
Note that each breakpoint is denoted also with a red stripe over the entire line. This color corresponds to a breakpoint that has not yet been reached. Later we will see how the line at breakpoint changes its color.
By the way, removing breakpoints is same easy – click the gutter.
Hover over a breakpoint. PyCharm shows a tooltip with the most essential breakpoint information – line number and script address. However, if you want to change breakpoint settings, you have to right-click a breakpoint. Try changing breakpoint settings for your own, and see how the breakpoint icon changes.
So, we are now ready for debugging. Let's start.
First of all, select the same Solver run/debug configuration from the run/debug configurations combobox, and click the Debug icon to the right.
What happens next?
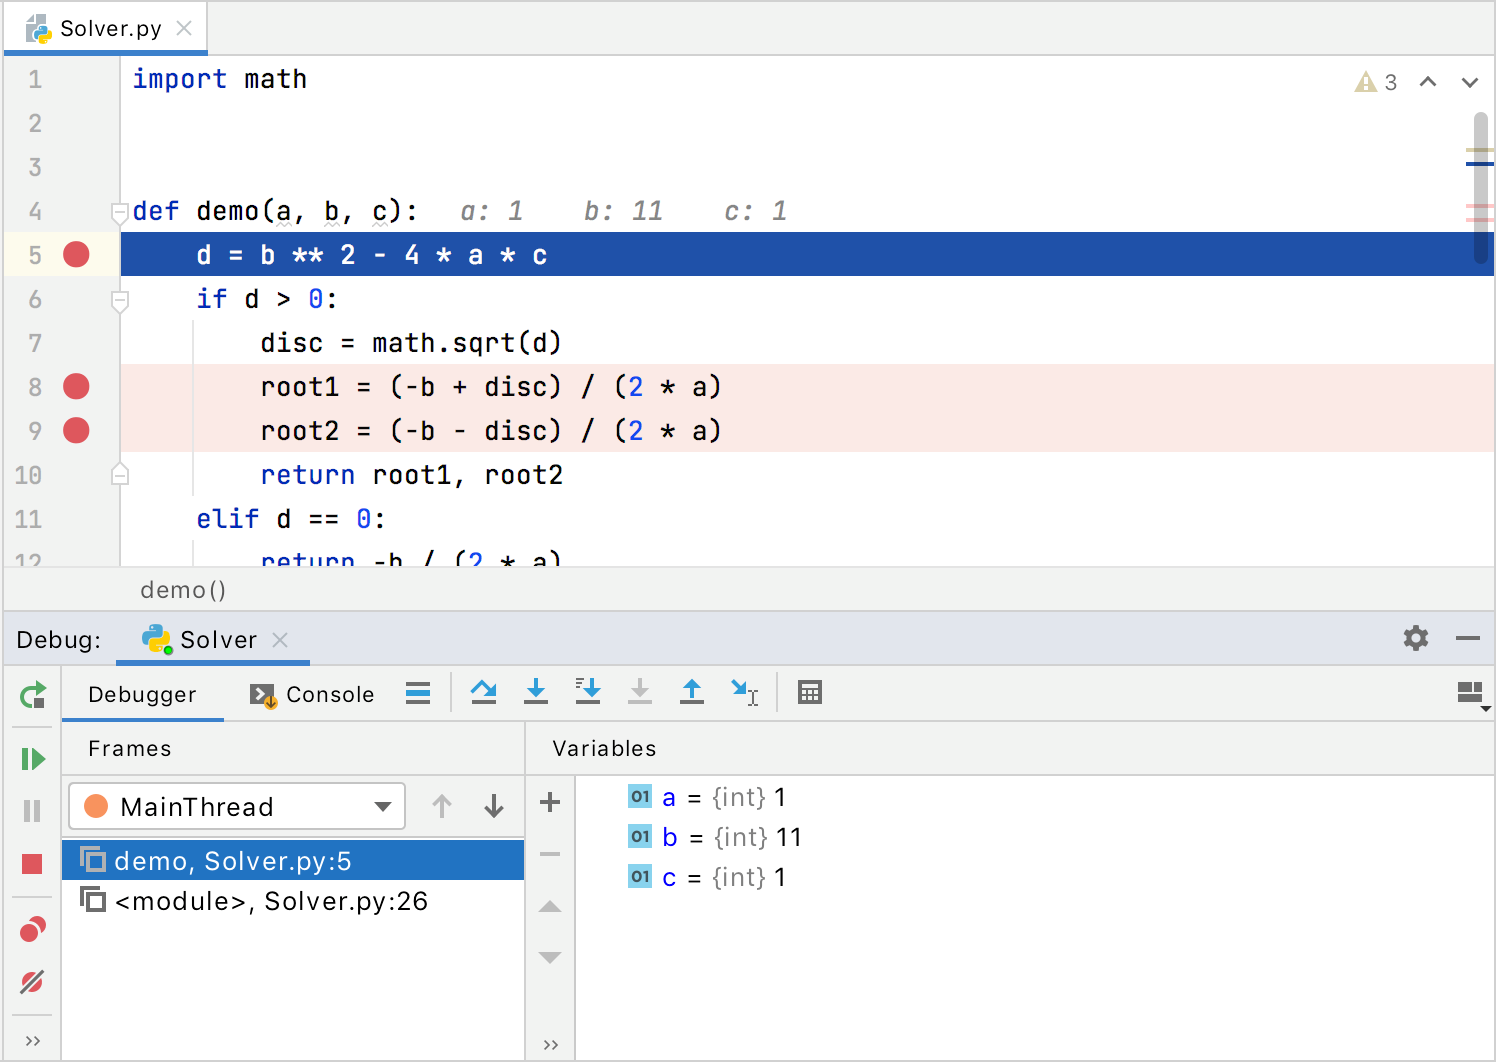
PyCharm starts, and then suspends execution at the first breakpoint.
The line at breakpoint becomes blue. It means that PyCharm has reached the line with the breakpoint, but has not yet executed it.
Next to the executed lines in the editor, the values of the variables appear.
The Debug tool window appears. This tool window shows all the important information related to debugging, and allows managing the debugging process.
For more information, refer to the product documentation.
OK, we've paused at the first breakpoint. What's next?
Press or click . The program will resume and pause at the next breakpoint. This way you can step through all the set breakpoints, observing the variables used in the application. For more information, refer to the part Debug of the documentation.
For more information, refer to the section Debugger tab.
Why do we need it at all? For example, you'd like to see the error messages, or perform some calculations not related to the current application... With PyCharm this is not a problem.
Click the Console tab to bring it forward, and then, on the toolbar of this tab, click the button :
The Python prompt appears, and the console becomes interactive. Try to execute Python commands in this interactive console:
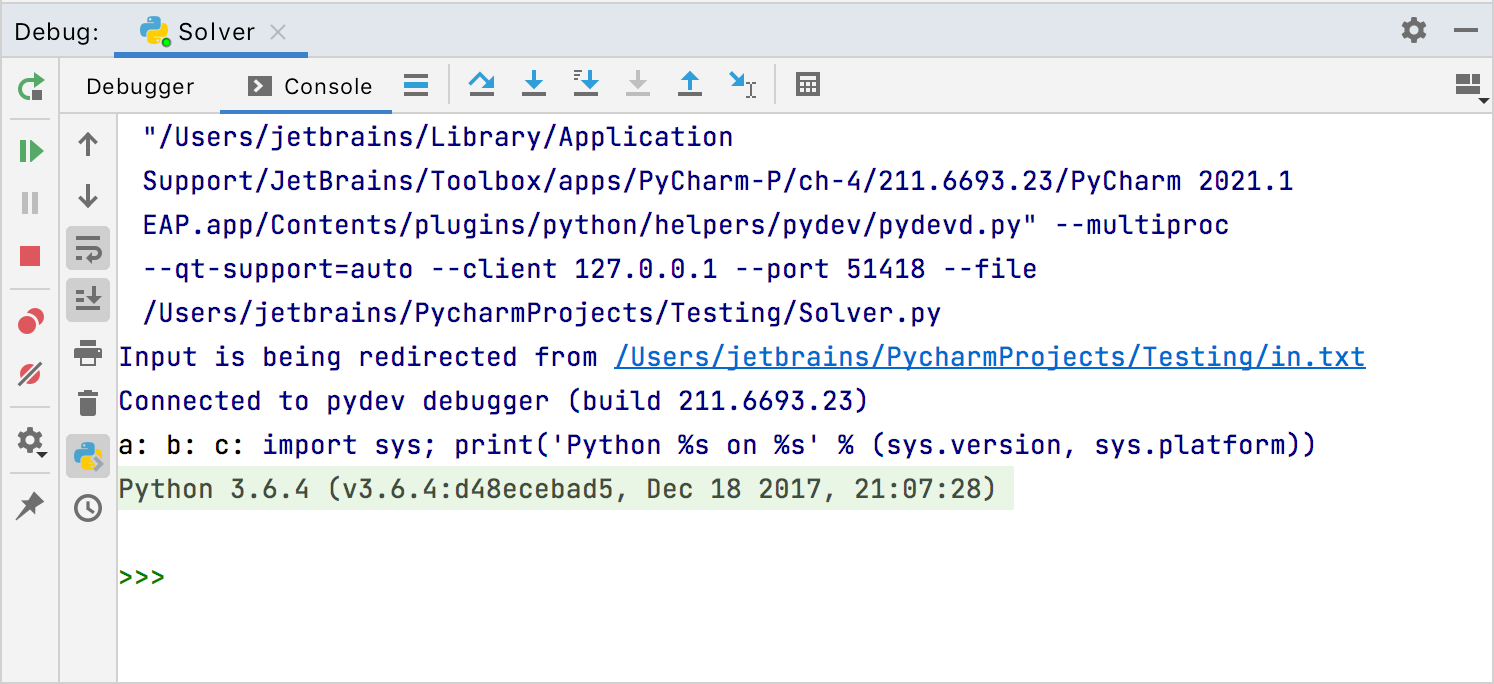
Note that interactive console provides code completion and history (Up/Down arrow keys). For more information, refer to the page Using Debug Console.
You can always invoke the debug console by using the command Tools | Open Debug Command Line from the main menu.
Finally, if you are used to working with an Python console, you can also do that right from within PyCharm. To launch the console, choose Tools | Python Console... from the main menu:
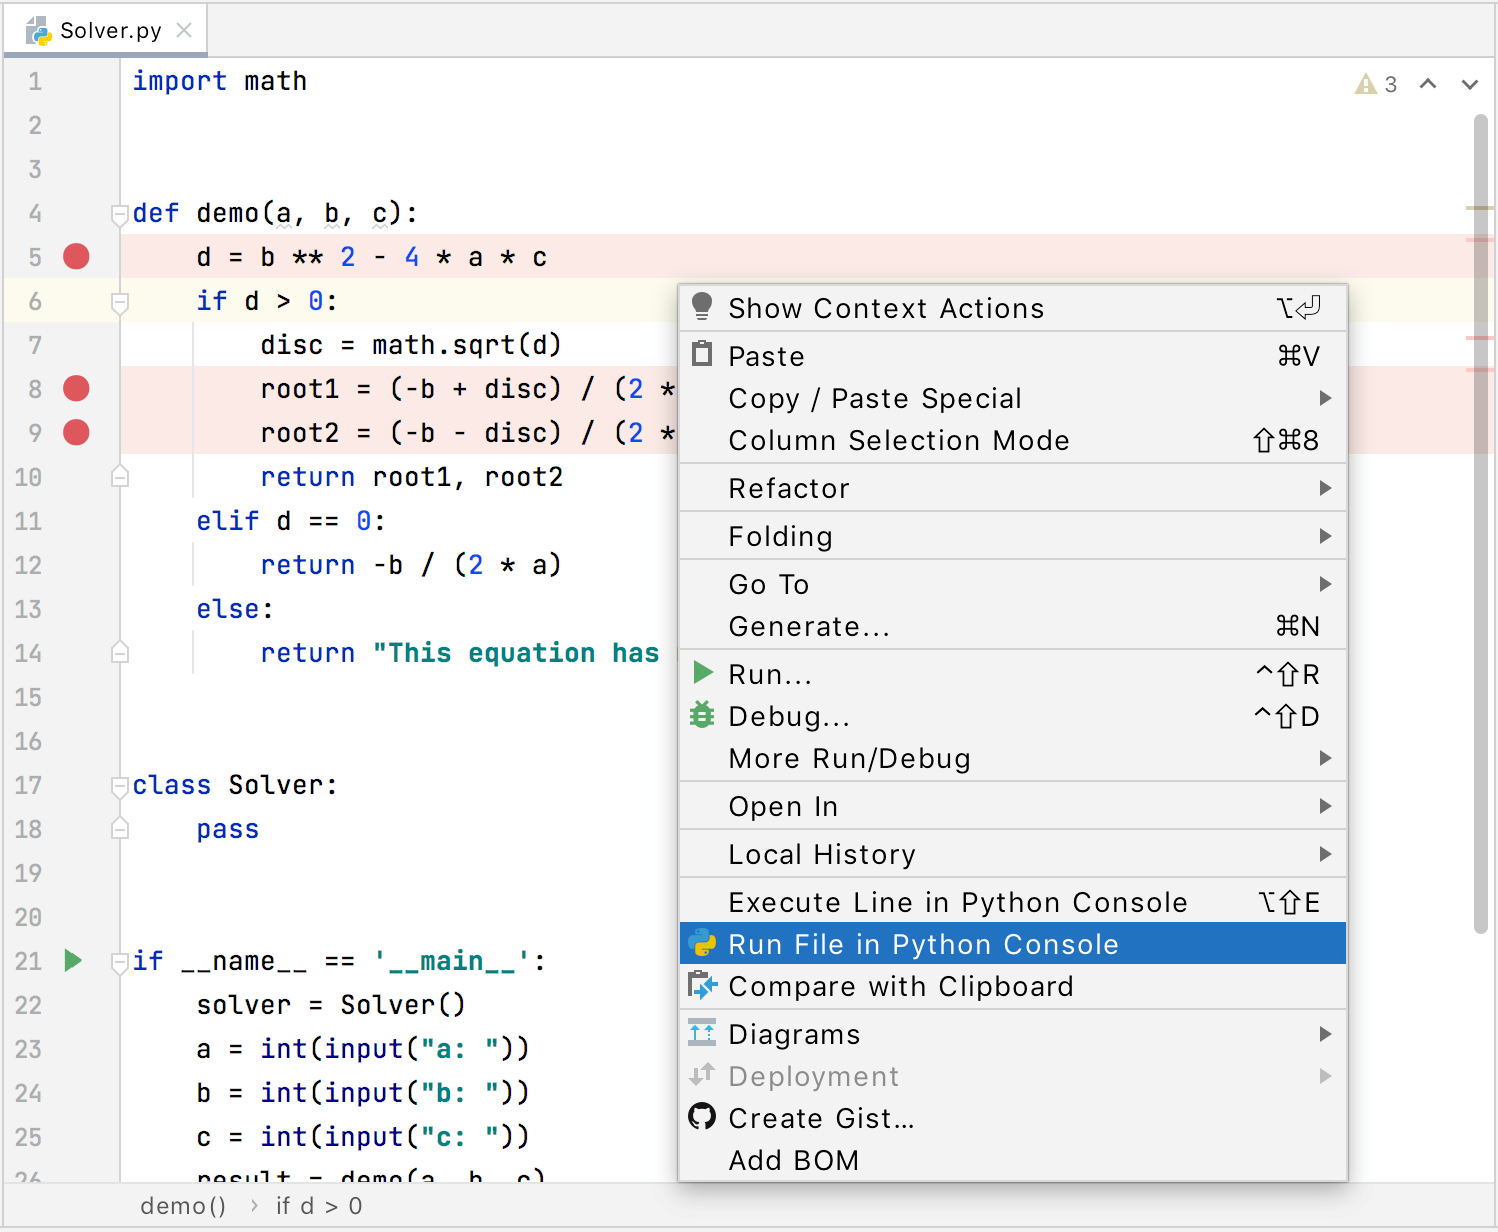
You can handle the script execution in the interactive mode:
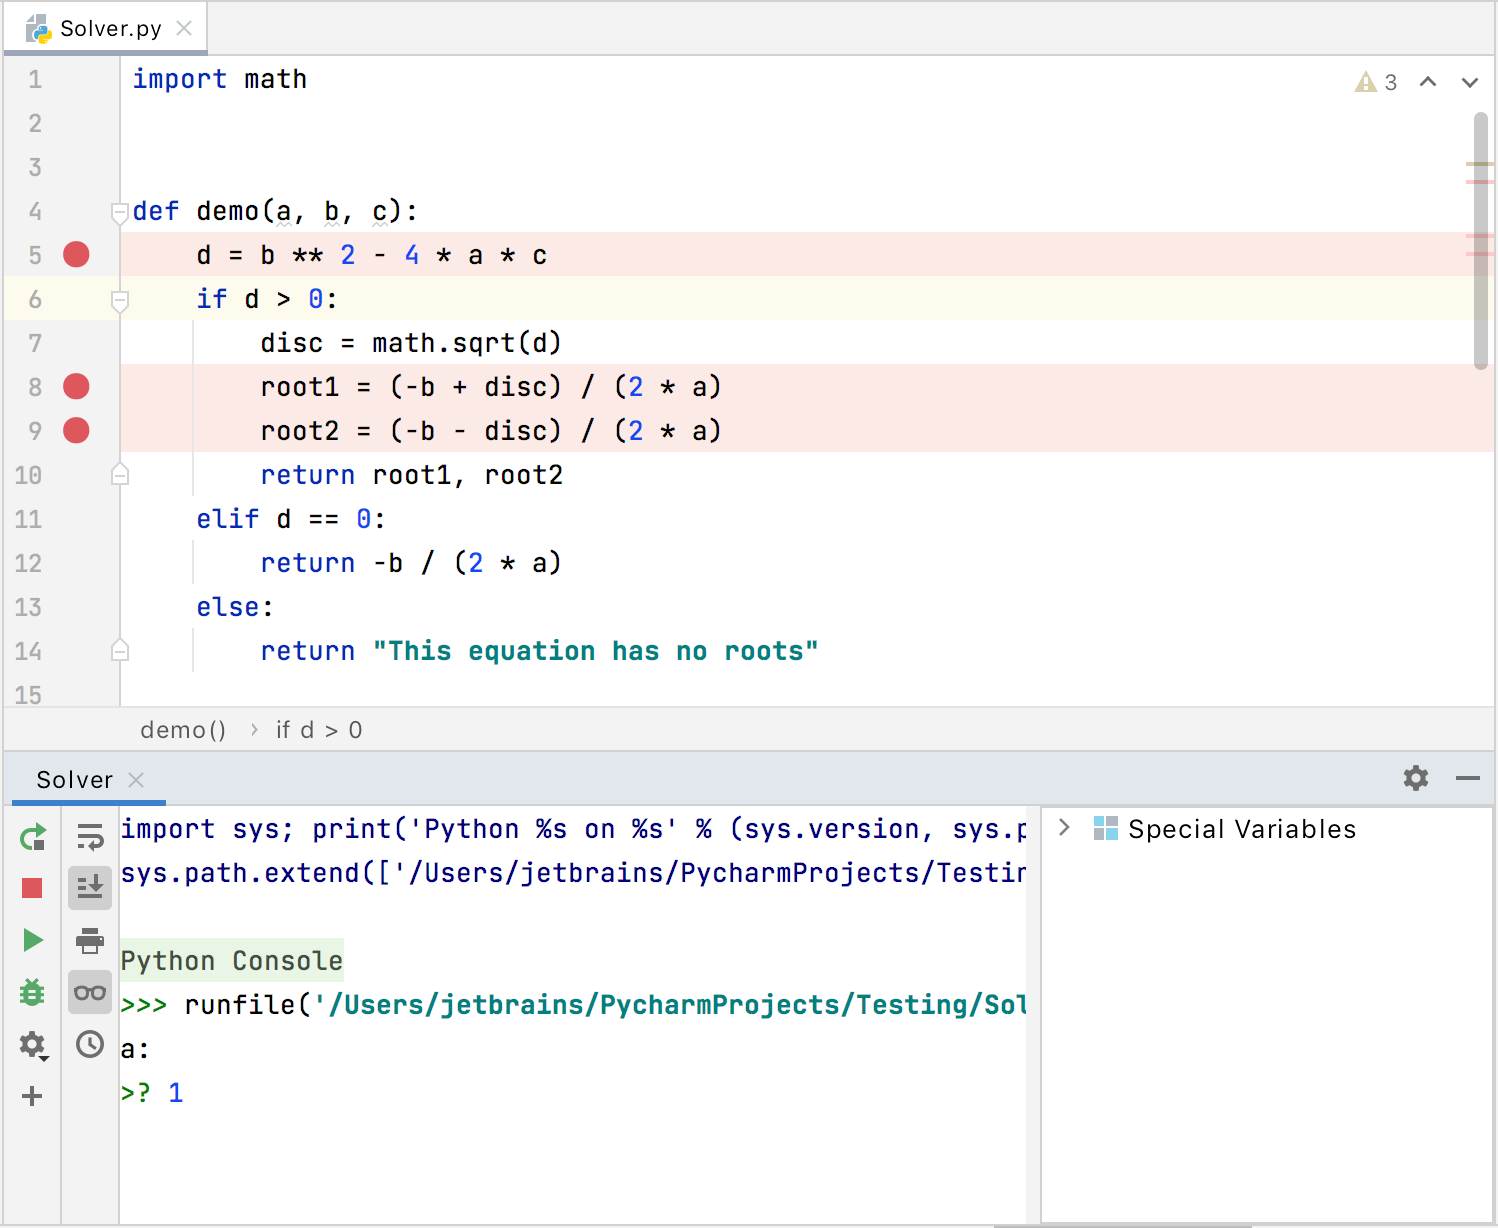
Python console enables executing Python commands and scripts line by line, similar to your experience with Python Shell.
The console appears as a tool window every time you choose the corresponding command on the Tools menu. You can assign a shortcut to open Python console: press , navigate to Keymap, specify a shortcut for Main menu | Tools | Python or Debug Console.
The main reason for using the Python console within PyCharm is to benefit from the main IDE features, such as code completion, code analysis, and quick fixes.

You can use up and down arrow keys to browse through the history of executed commands, and repeat the desired ones. To preview the variable values calculated in the course of the execution, click and check the Special Variables list.

The console is available for all types of Python interpreters and virtual environments, both local and remote.
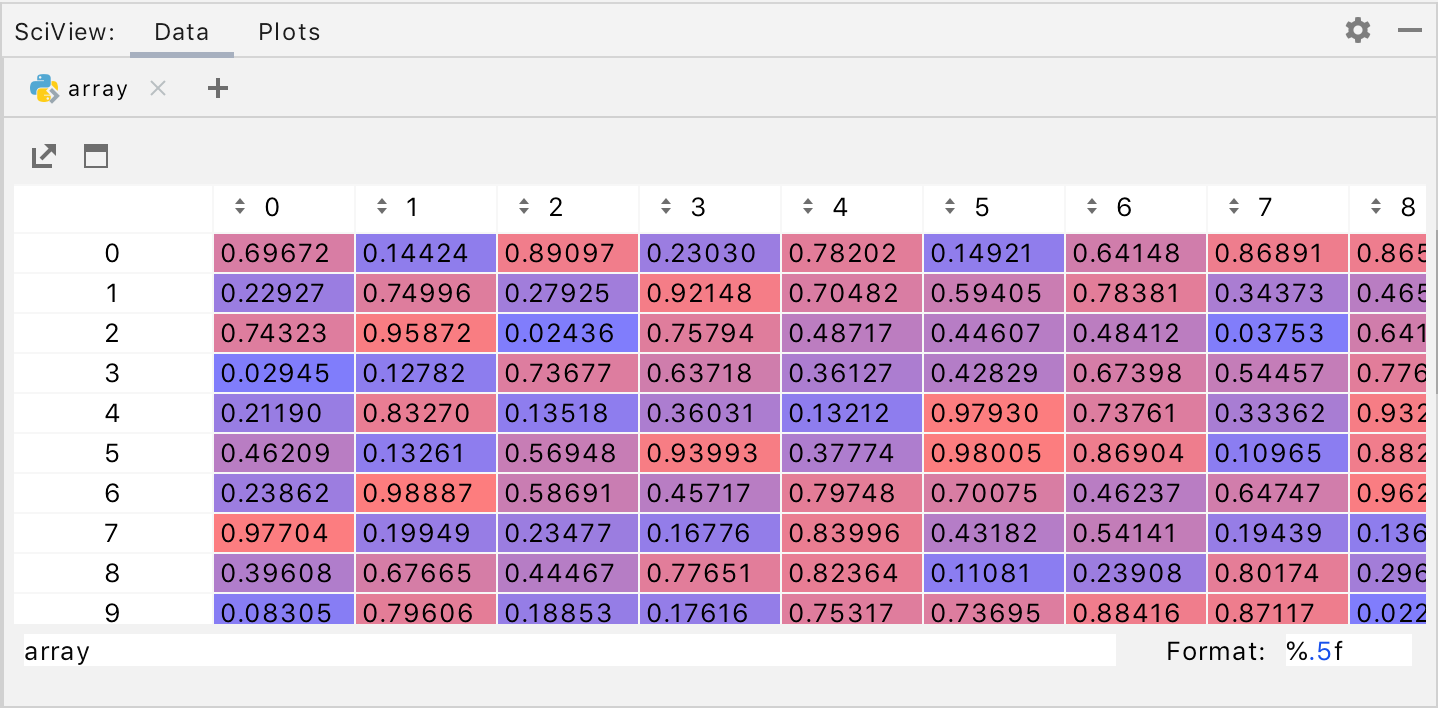
When your variables are numpy arrays or dataframes, you can preview them as an array in a separate window. To try it, do one of the following:
Click the link View as Array/View as DataFrame:

From the context menu of a variable, choose View as Array/View as DataFrame:

The variable will be opened in the Data tab of the SciView window.
Open file in the editor, and select a fragment of code to be executed.
From the context menu of the selection, choose Execute Selection in Python Console, or press:

note
With no selection, the command changes to Execute line in console. Choose this command from the context menu, or press . The line at caret loads into the Python console, and runs.
Watch the code selection execution:

By default, the Python console executes Python commands using the Python interpreter defined for the project. However, you can assign an alternative Python interpreter.
In the editor, select a fragment of code which contains the definition of an asyncio coroutine.
From the context menu, select Execute Selection in Python Console, or press:

After the code is executed on the Python console, run the coroutine by using the
awaitkeyword:
In the Settings dialog (), select Build, Execution, Deployment | Console | Python Console.
Select any available interpreter from the Python interpreter list. Note that you cannot introduce a new interpreter here. If you want to come up with the new interpreter, you need to create it first.

In needed, click the Configure Interpreters link to inspect the list of the installed packages and add new ones.
Mind the code in the Starting script area. It contains the script that will be executed after you open the Python console. Use it to pre-code some required Python commands.
When working on several Python scripts, you might want to execute each in a separate Python console.
Click
to add a new Python console.
By default, each console has the name Python Console with an index. To make a console reflect the script you're running, right-click the console tab, select Rename Console, and enter any meaningful name.

All the commands you're running in the Python console are executed one by one. If the commands require substantial time to get executed, you might want to preview and manage the execution queue.
Go to Settings | Build, Execution, Deployment | Console and enable the Command queue for Python Console checkbox.
Click
on the console toolbar to open the queue.

In the Python Console Command Queue dialog, review the list of commands. If needed, click
to delete the command from the queue.
Note, once the command is executed, it disappears from the queue. To preview all previously executed commands browse the console history ().