Control Profiling Session
After you configure profiling settings and run the session, the dotTrace Controller window opens.

To manually control the profiling session, use the buttons on the dotTrace Controller window:
Start | Start collecting performance data. The button is shown in case the Collect profiling data from start checkbox was not selected in the profiling options. |
Get Snapshot and Wait | Generate a snapshot and stop collecting performance data. The alternative option (selected in the same drop down list) is Get Snapshot and Start: generate a snapshot and continue collecting performance data.
|
Drop | Discard collected data and stop collecting performance data. |
Detach, Detach All | Detach dotTrace from the profiled process, but keep the process running. Not available when using the Tracing or Line-by-line profiling types. The snapshot is not taken. |
Kill, Kill All | Terminate the profiled processes. The snapshot is not taken. |
Stop Service | Stop the profiled service. This button is displayed only when profiling a Windows service. |
If your standalone or .NET Core application runs more than one process, you can either take a snapshot of a particular process or take snapshots of all processes at once.
Start profiling with the enabled Profile child processes profiling option.
In the Controller window, do one of the following:
Select the desired process from the list.
Expand the dotTrace Controller window by clicking the
 button.
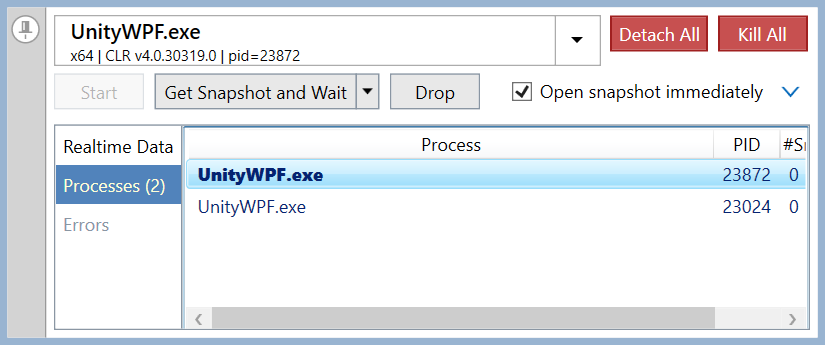
Click the Processes tab.
Double-click the desired process.
Click Get Snapshot and Wait.

The Processes page shows process names (the Process column), PID, and a number of snapshots taken for each process (the #Snapshots column). The currently selected process is shown in bold.
Start profiling with the enabled Profile child processes profiling option.
In the Controller window, hold Ctrl and click Get Snapshot and Wait.
After this, the snapshot of the main process will be opened in a viewer. Other snapshots will not be automatically opened, but will be available in the list of snapshots.
To access additional functionality of the dotTrace Controller window, expand it by clicking the ![]() button.
button.
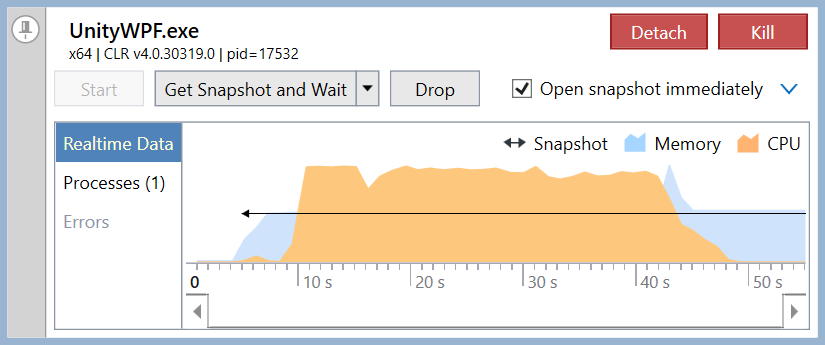
The Realtime Data page provides an overview of application activity showing CPU activity and memory consumption graphs.

The Errors page contains the list of errors that occur during profiling.