Custom profiler configurations
Configure: Settings | Build, Execution, Deployment | Java Profiler
For CPU and allocation profiling, IntelliJ IDEA provides integration with the following profilers:
Java Flight Recorder – a standard profiling tool shipped as part of the JDK.
Async Profiler – a very accurate profiler that can also collect native call and memory allocation data.
By default, IntelliJ IDEA runs both profilers in parallel to provide the most accurate results. While it is possible to use the supported profilers separately, the combined configuration that you get out of the box is a better choice for most scenarios. This approach leverages the advantages of both profilers and abstracts you from any setup whatsoever unless you have very specific requirements.
The Async Profiler and Java Flight Recorder configurations allow you to run these tools separately and fine-tune them according to specific requirements. This topic describes how to set up these configurations and environment.
Go to Settings | Build, Execution, Deployment | Java Profiler.
Click Add New Configuration and select the profiler.
Modify the profiler options as required.
For the options' meaning and purpose, refer to the Async Profiler and Java Flight Recorder chapters respectively.
note
Async profiler is compatible with HotSpot JVM and some other Java runtimes.
On Windows and macOS, the profiler works out of the box. If you are on Linux, you have to adjust kernel options before you start profiling.
Adjust perf_event_paranoid. This option controls the use of the performance events data by non-root users.
Set the value to be less than 2 to let the profiler collect performance information without root privileges:
sudo sh -c 'echo 1 >/proc/sys/kernel/perf_event_paranoid'Adjust kptr_restrict. This option sets restrictions on exposing kernel addresses.
To have kernel symbols properly resolved, disable the protection offered by kptr_restrict by setting its value to 0:
sudo sh -c 'echo 0 >/proc/sys/kernel/kptr_restrict'
By default, these changes affect your current OS session only. To keep the settings across system reboots, run:
sudo sh -c 'echo kernel.perf_event_paranoid=1 >> /etc/sysctl.d/99-perf.conf'
sudo sh -c 'echo kernel.kptr_restrict=0 >> /etc/sysctl.d/99-perf.conf'
sudo sh -c 'sysctl --system'note
You can find the detailed explanations of Async Profiler configuration in the official documentation on GitHub.
Option | Description |
|---|---|
Agent Options | The options that will be passed to the agent. They can be used, for example, to enable wall-clock profiling, or adjust the sampling interval. |
Agent | The agent that will be used for profiling. |
Java Flight Recorder is available on Windows, Linux, and macOS. It is supported natively in the following JDK builds:
Oracle JDK 8-10: provided that the
UnlockCommercialFeaturesVM option is enabledOracle JDK 11 and later
OpenJDK 11 and later
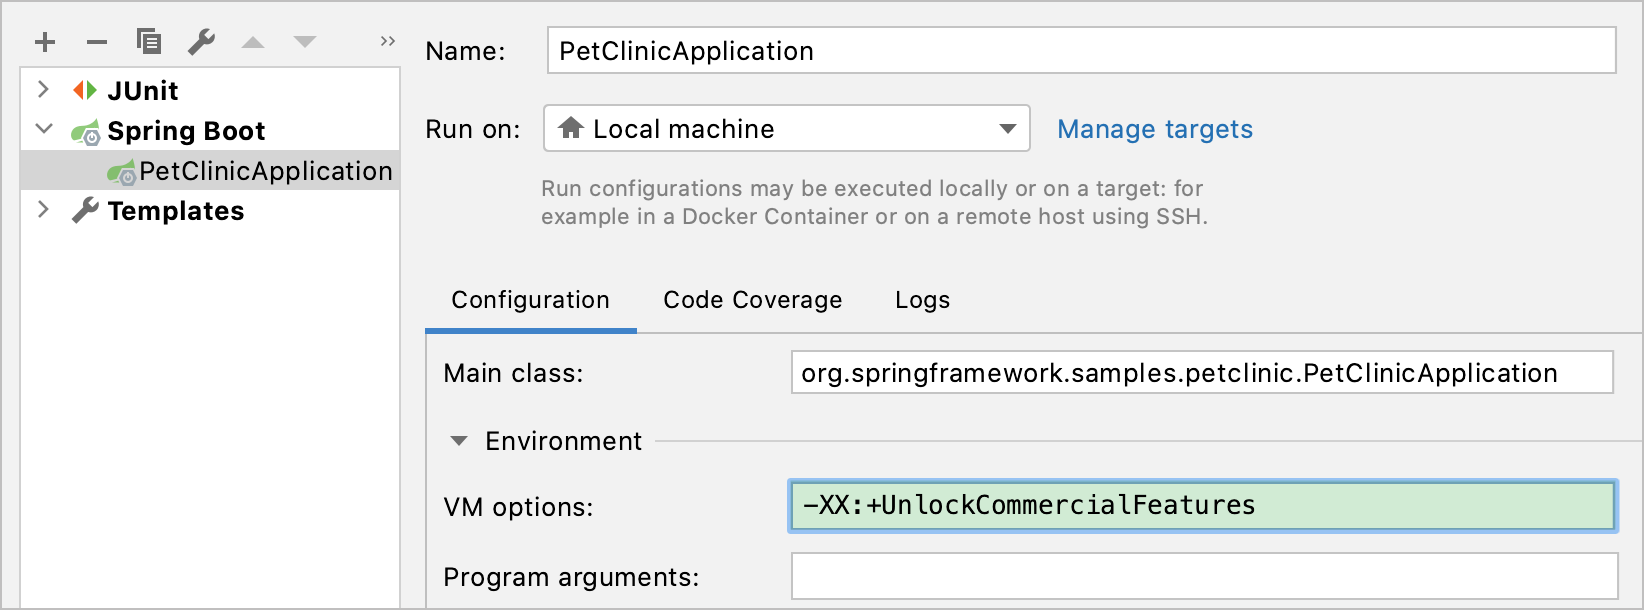
In the main menu, go to Run | Edit Configurations and from the list on the left, select the run configuration that you want to analyze with JFR.
To the VM options field, add the following line:
-XX:+UnlockCommercialFeatures.warning
The flag unlocks commercial features that are the products Oracle Java SE Advanced or Oracle Java SE Suite. Before enabling them, read Oracle Binary Code License Agreement for the JAVA SE Platform Products carefully.
Apply the changes and close the dialog.

There are two pre-installed configurations: Default and Profile. The Default configuration has low overhead (about 1%). That's why it works well for continuous profiling. The Profile configuration has overhead about 2% and can be used for more detailed application profiling.
These configurations cover most use cases. You can select the most suitable configuration in Settings | Build, Execution, Deployment | Java Profiler | Java Flight Recorder.
If the pre-defined configurations don't meet your needs, you can create and upload your own settings by means of Java Mission Control.
Run Java Mission Control that you can find in JAVA_HOME
/bin or download from https://jdk.java.net/jmc/./jmc From the Java Mission Control main menu, select Window | Flight Recording Template Manager.
Click Import Files on the panel on the right and select one of the pre-installed configurations in the .jfc format:
For Java 10 and earlier: JAVA_HOME
/jre /lib /jfr/ For Java 11 and later: JAVA_HOME
/Contents /Home /lib /jfr/
Select Edit | Advanced, change the necessary settings, and click OK.
In the Flight Recording Template Manager dialog, click Export File.
Specify another name for the new settings file and change its location if necessary. Click Save.
For more information about configuring custom settings, refer to Controlling Recording Data by Using Templates.
tip
The default JAVA_HOME path on Windows is: C:
\Program Files , on macOS:\Java /Library ./Java /JavaVirtualMachines
In the Settings dialog () , select Build, Execution, Deployment | Java Profiler.
Select the Java Flight Recorder profiling configuration to which you want to load your custom settings or create a new configuration by clicking
.
In the Profiling Settings area, select the Custom settings file option and click
.
Specify the path to the custom settings file and click Open.
Apply the changes and close the dialog.