Read the profiler snapshot
Last modified: 11 February 2024The snapshot made with the IntelliJ Profiler configuration can be viewed in the following modes:
CPU Time – the subset of samples that corresponds to actual CPU work, excluding IO, waiting on locks, context-switching, and the like. Useful for identifying CPU-intensive sections, where you can get the most benefit from optimizations such as improving algorithm complexity.
Total Time – all samples, including those for sleeping threads. This mode is useful to consider perceived performance and actual runtime, including IO, context-switching overhead, synchronization, and so on. With it, you can spot sections that may be slowed down by external factors or suboptimal concurrency.
Memory Allocations – the subset of samples that corresponds to memory allocation events. This mode is useful to identify memory-intensive sections, where you can get the most benefit from optimizing the amount of primitives boxing, objects creation, and so on.
tip
For more information about sampling, see: How IntelliJ IDEA profiler works
Switch viewing mode
Use the menu in the top-right corner of the tool window.

IntelliJ IDEA provides several facilities to analyze the snapshot:
In-editor hints – an intuitive way to assess the performance of the particular lines of code right in the editor
Call tree – a tree representing the code paths and their share in the overall CPU/memory usage
Flame graph – a graphic representation of the code paths that facilitates analysis and navigation by representing stack frames as visual elements
Method list – a flat view providing aggregated statistics for individual methods rather than code paths
Timeline – a visual representation of threads' activity over time
Navigate the snapshot
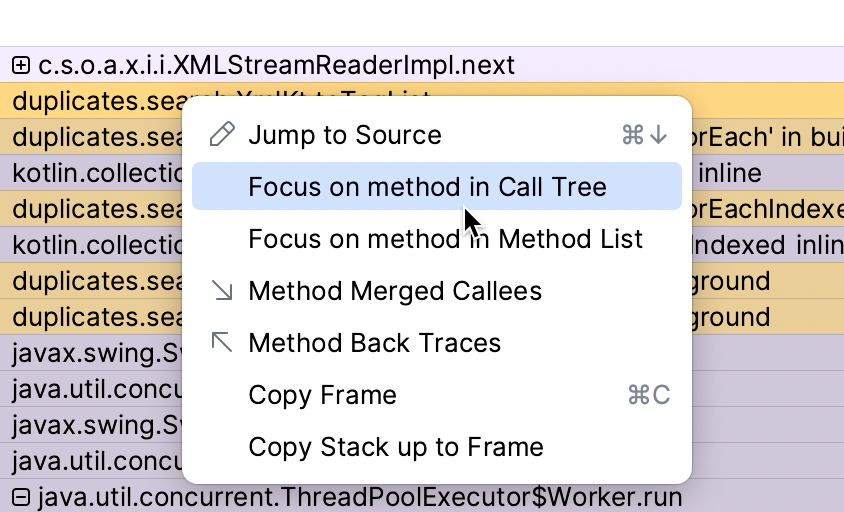
When you focus on a specific method in a tab of the Profiler tool window, IntelliJ IDEA opens the corresponding source in the editor. Also, you can right-click it and select another Profiler tool window tab to open it in.
Threads
The profiling data in the Profiler tool window tabs is grouped by thread. You can select to view merged data for the entire process (All threads merged) or select a specific thread for closer investigation.
note
In-editor profiler hints always show the combined runtime for all threads.

The threads are listed on the left-hand side of the Profiler tool window and sorted by the number of collected samples. Thus, you can find the most busy threads at the top of the list.
Line profiler
When you open a snapshot, IntelliJ IDEA shows the Profiler tool window and adds runtime hints near the corresponding lines right in the editor.
Lines that took a significant amount of time to execute get grey labels, while the most resource consuming methods are marked with red labels with the fire icon.

tip
Switching the viewing mode in the Profiler tool window also changes the mode for the labels in the editor. You can choose to view the total execution time of the method, its CPU time, or the amount of memory allocated as the result of executing this line.
If you want to drill-down and see what's inside a labeled method, clicking the hint will take you to the method declaration, where you can inspect the implementation for particular lines causing slowness.

Flame Graph
The flame graph visualizes the application call tree with the rectangles that stand for frames of the call stack, ordered by width. Frames that consume more resources are wider than the others and are placed on the left.

For example, we can make the following observations from the flame graph above:
The execution time of
main()was contributed to by the methodsa()andb(). In its turna()calledc().c()is mostly adding elements to anArrayList, which could take less time if the capacity of theArrayListwas adequate –addis mostly busy growing the list.Most of the time
b()is processingIndexOutOfBoundsException. It may be a good idea to analyze where these exceptions come from and see if we can do anything about it.
note
The flame graph only reflects the execution summary. It aggregates stack traces, ignoring their chronological order. Thus, details such as when exactly a method was executed are out-of-scope for this type of analysis
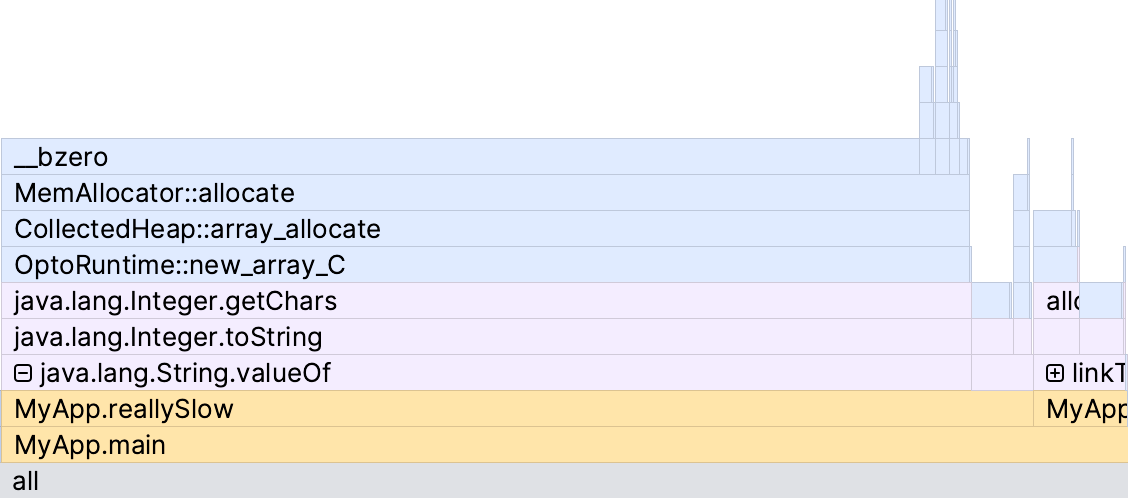
IntelliJ Profiler uses color-coding to differentiate between the different types of frames:
Frame type | Light theme | Dark theme |
|---|---|---|
Project code | Yellow | Yellow |
Library code | Purple | Grey |
Native code | Blue | Blue |
note
Native profiling is turned off by default. To enable it, go to Settings | Build, Execution, Deployment | Java Profiler and check the Collect native calls option.
Get call details
Hover over a block to see the tooltip with frame details. The tooltip shows the share of time in the entire snapshot and in the frame's direct parent.

Zoom the graph
Use the
and
buttons on the flame graph's toolbar or the scroll wheel to zoom the graph.
To focus on a specific method, double-click the corresponding block on the graph.
To restore the original size of the graph, click 1:1 on the toolbar.

Set node threshold
It may be difficult to tell if a node accounts for a substantial portion of time or samples in the snapshot, particularly when the view zoomed in, and the scale is not easily identifiable. In this case, you can set a threshold to grey out nodes that are not heavy enough.
Click
and select Show Nodes Filter.
Use the slider to the right of the flame graph. The nodes that do not pass this threshold will appear colorless.

Search the graph
If you want to locate a specific method on the graph, start typing its name or click
and type the name in the search bar.
The graph highlights all blocks with method names matching your search request.

Use
and
for fast navigation between search results. Using the buttons on the toolbar, you can also search either the whole graph or a specific subtree and navigate to the results as soon as something was found.
Capture the graph
You can capture and export the graph separately from other data in the snapshot.
Click
and select Copy to Clipboard or click Save to export the graph as an image in the .png format.
tip
For more information about flame graphs, refer to Flame Graphs.
Call Tree
The Call Tree tab organizes the sampled data in a tree-like structure.
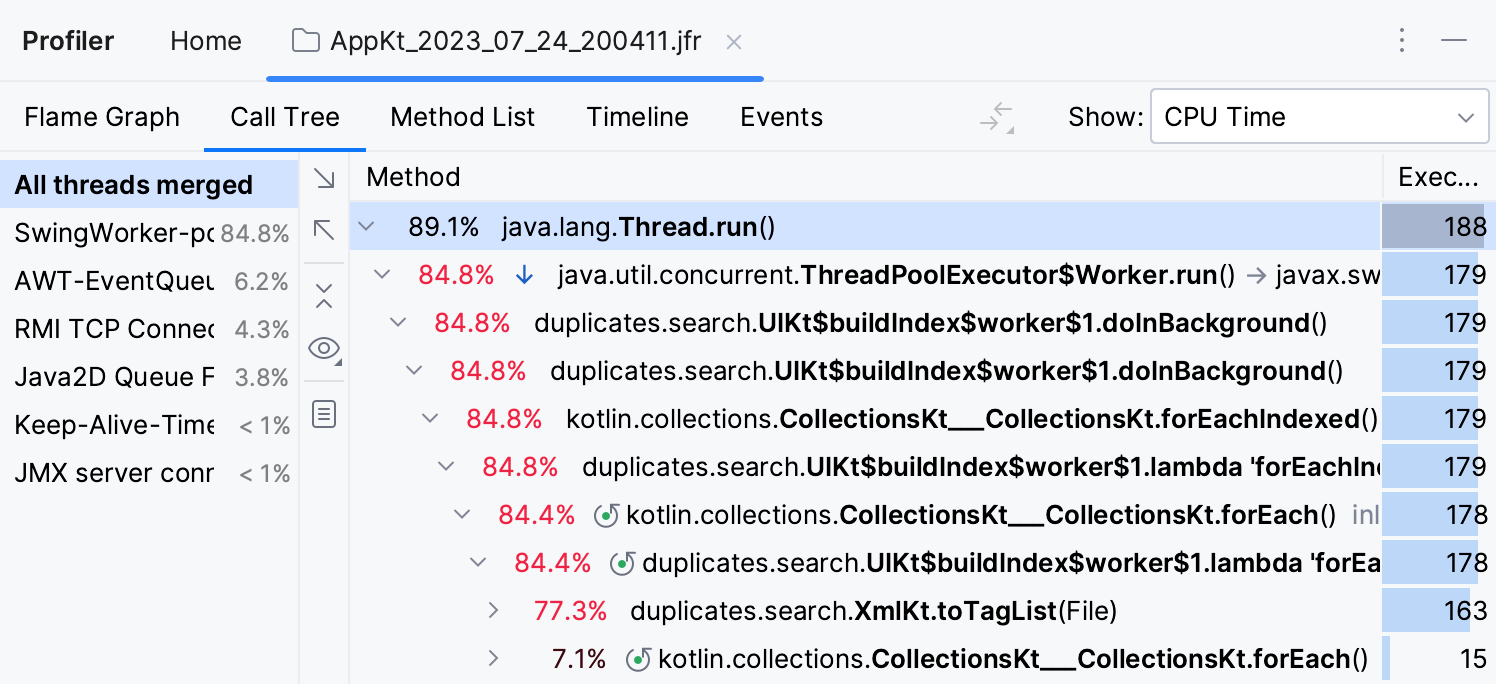
For each method, the tab shows the following information:
Share in the total execution time or parent's execution time
The aggregated execution time
By default, the percentage is relative to the total execution time. You can choose to view the numbers relative to the parent frame.
Switch the percentage between total and parent
Click
and select Show Percent of Total Time or Show Percent of Parent.

Filter Call Tree results
The Call Tree tab allows you to collapse the frames you are not interested in at the moment. For example, you can hide library classes or the classes that come from specific frameworks to focus on the application code.
The blue arrow right after the percentage presents a filtered sequence of calls.

Disable filtering
Click
and deselect the Filter Calls option.
Configure filtering rules
In the Settings dialog () , select Build, Execution, Deployment | Java Profiler | Filters.
In this dialog, you can modify the existing rules and add new ones.
Configure the packages or specific classes that you want to hide in the output.
To filter all methods in a class, specify the fully qualified class name (for example:
org.bar.ClassName).To filter specific methods in a class, use the following format: fully qualified class name : method name (for example:
* : myMethod()).
Collapse recursive calls
A stack that involves recursion may be very difficult to analyze. In a regular Call Tree view, recursive calls are displayed as they are called – one after another, which may lead to almost infinite stack scrolling.
IntelliJ IDEA detects recursion when the same method is called higher up in the call stack. In this case, the subtree is taken out of the call tree and then attached back to the first invocation of that method. This way you can bypass recursion and focus on methods that consume most of the resources and calls that they make.
Collapsing recursive calls allows you to see the total amount of time spent in these calls as if there was no recursion.
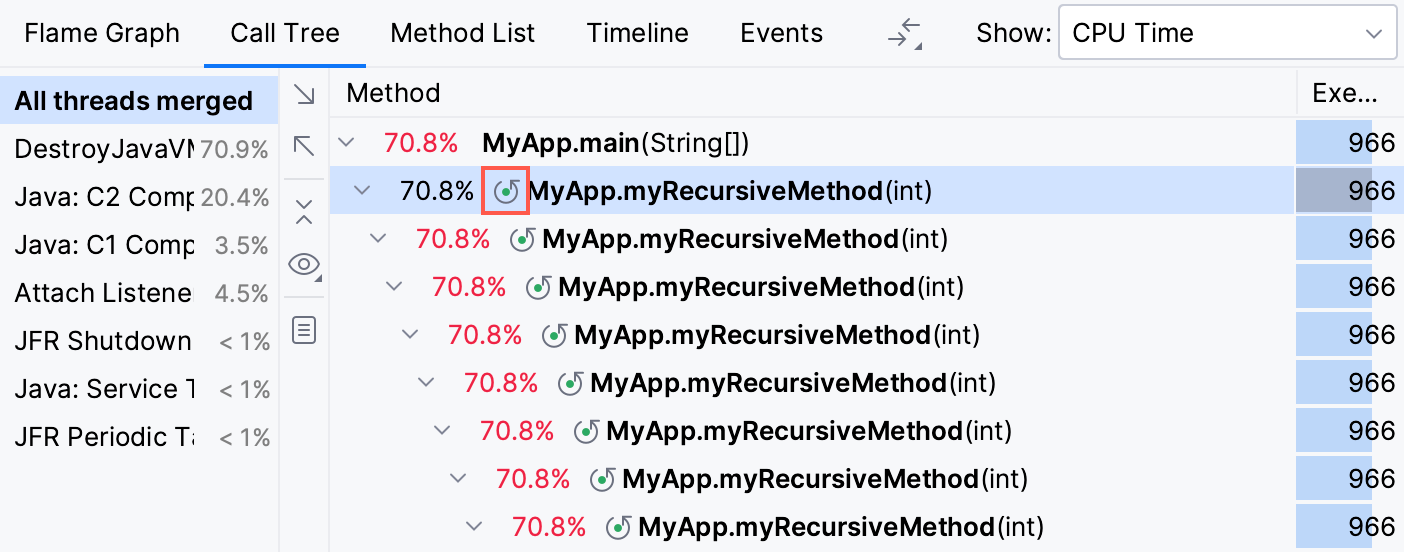
Folded recursive calls are marked with the icon on the Call Tree tab. Click it to open the recursive call tree in a separate tab. You can preview the number of merged calls in the tooltip that appears on hovering over the recursion icon.
What-if: focus on specific methods
IntelliJ IDEA allows you to examine specific nodes and subtrees in the Call Tree: you can exclude particular methods or the other way round, focus only on the nodes in which you are interested at the moment.
Right-click the necessary node on the Call Tree tab and select one of the following options to open the results in a dedicated tab:
Focus On Subtree: show only the selected method call. Parent method sample counter shows only the time spent in the selected subtree.
Focus On Call: show the selected method and the methods that call it. When this option is enabled, every frame shows only the time spent in the selected method.
Exclude Subtree: ignore the selected method call.
Exclude Call: ignore all calls to the selected method.
Method List
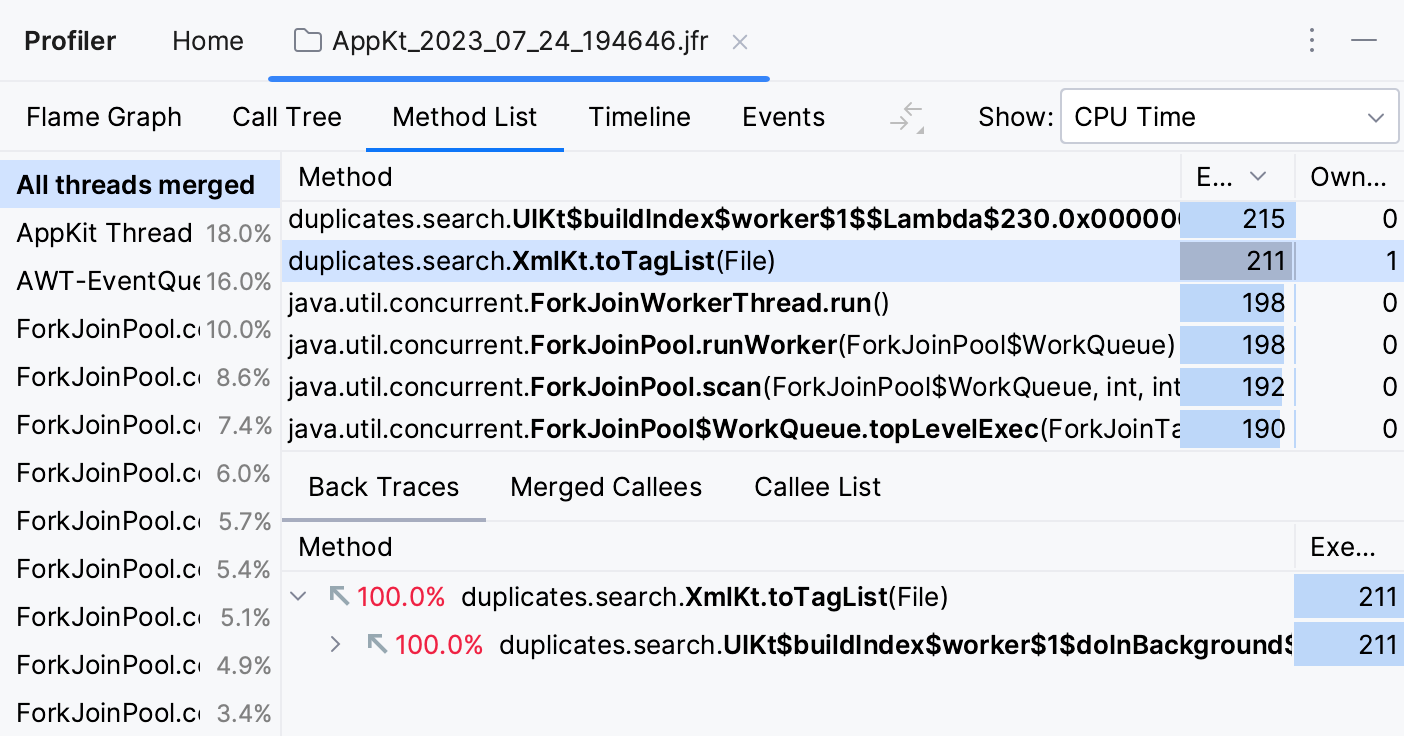
The Method List collects all methods in the profile data and sorts them by cumulative sample time. Every item in this list has several views:
Back Traces shows the hierarchy of callers. Use this view to trace which methods call the selected method.
Merged Callees is the call tree summarizing the methods down the call hierarchy.
Callee List is the method list summarizing the methods down the call hierarchy.
Timeline
The timeline provides the ability to monitor the activity of individual threads. It visualizes CPU activity and memory allocation over time, which is useful for a range of tasks, such as finding out the most active threads, investigating concurrency issues, and profiling I/O.
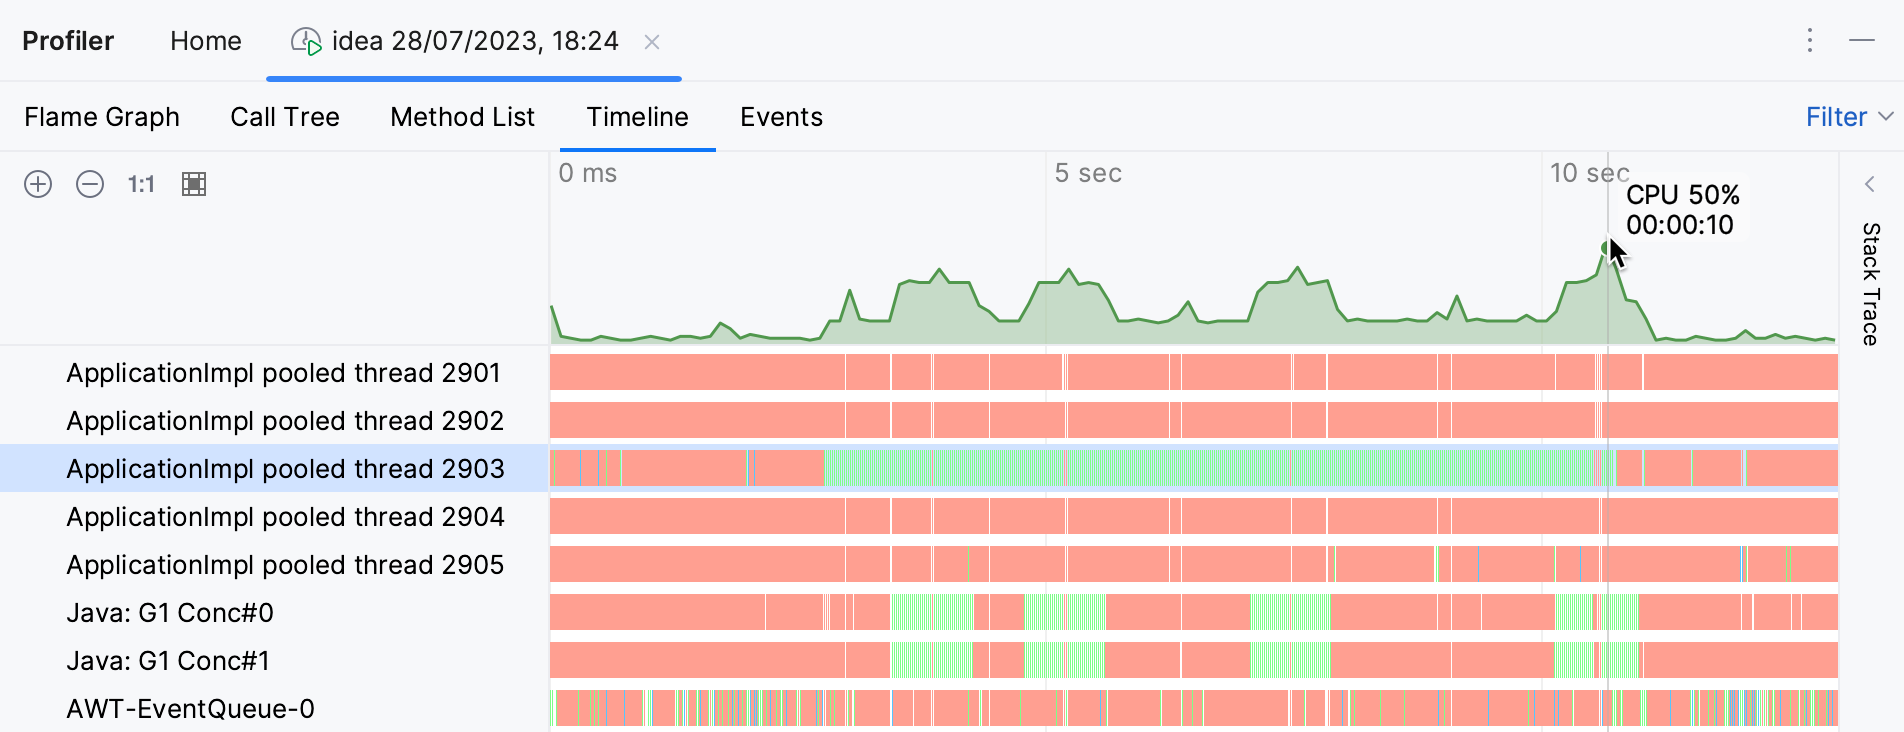
Red vertical bars indicate thread sleeping state
Green vertical bars indicate thread running state
Blue vertical bars indicate memory allocation events
The chart at the top shows CPU load
Filter events on the timeline
Open the Filter menu in the top-right corner of the tool window and select the types of events that have to be visible.
Get the stacktrace for an event
Click an event on the timeline. The stack trace appears on the right-hand side of the Profiler tool window.

tip
You can navigate to the method declaration by clicking the corresponding stack frame.