Tutorial: Get started with CPU profiling
Sometimes your app works, but you want to increase performance by boosting its throughput or reducing latency. Other times, you just want to know how code behaves at runtime, determine where the hot spots are, or figure out how a framework operates under the hood.
Partly, you can this information at design time, as IntelliJ IDEA provides you with all sorts of clues that can be produced statically. Of course, you cannot learn about all the bugs and inefficiencies by just looking at the code, because things get more complicated at runtime. Verifying any guesses you have can prove to be a tough task without the right tools at hand.
The profiler offers a bird’s eye view of arbitrarily large execution chunks. It does not interfere with the running program, nor does it provide granular data like the debugger does. However, it can collect valuable information no other tool can, which is why in this tutorial we are going to take a look at the capabilities of IntelliJ IDEA profiler.
Many people believe that they don’t need to learn how to profile as long as they don’t write high-load applications. In the example, we’ll see how we can benefit from profiling even when dealing with very simple apps.
Let’s say we have the following application: https://github.com/flounder4130/profiler-example.
It repeatedly tries to create a path in the file system (we use createDirectories() from NIO2 for that). If an attempt fails, no exception is raised. We measure the throughput using an improvised benchmark.
Every time a task runs, the benchmark logic stores the current timestamp to a collection and removes all timestamps that point to a time earlier than the current time minus some interval. This makes it possible to find out how many events occurred during this time interval by just querying the collection. This workflow is supposed to help us understand how well or poorly our application performs.
When we run the program, we find that it doesn’t perform up to our expectations:
Average count: 3527 op
Spent time: 3052 ms
Let’s profile it and see what’s wrong.
IntelliJ Profiler does not need any special setup, however, in this example we need to use native profiling, which is disabled by default.
Press to open the IDE settings and then select Build, Execution, Deployment | Java Profiler. Select the Collect native calls checkbox.
Click
near the entry point of the application (the
CountEventsclass in our example).From the menu, select Profile CountEvents.main() with IntelliJ Profiler.

When the app has finished running, a green popup will appear prompting us to open the report. If we dismiss the popup by mistake, the report will still be available in the Profiler tool window.

Let's open the report and see what's in it.
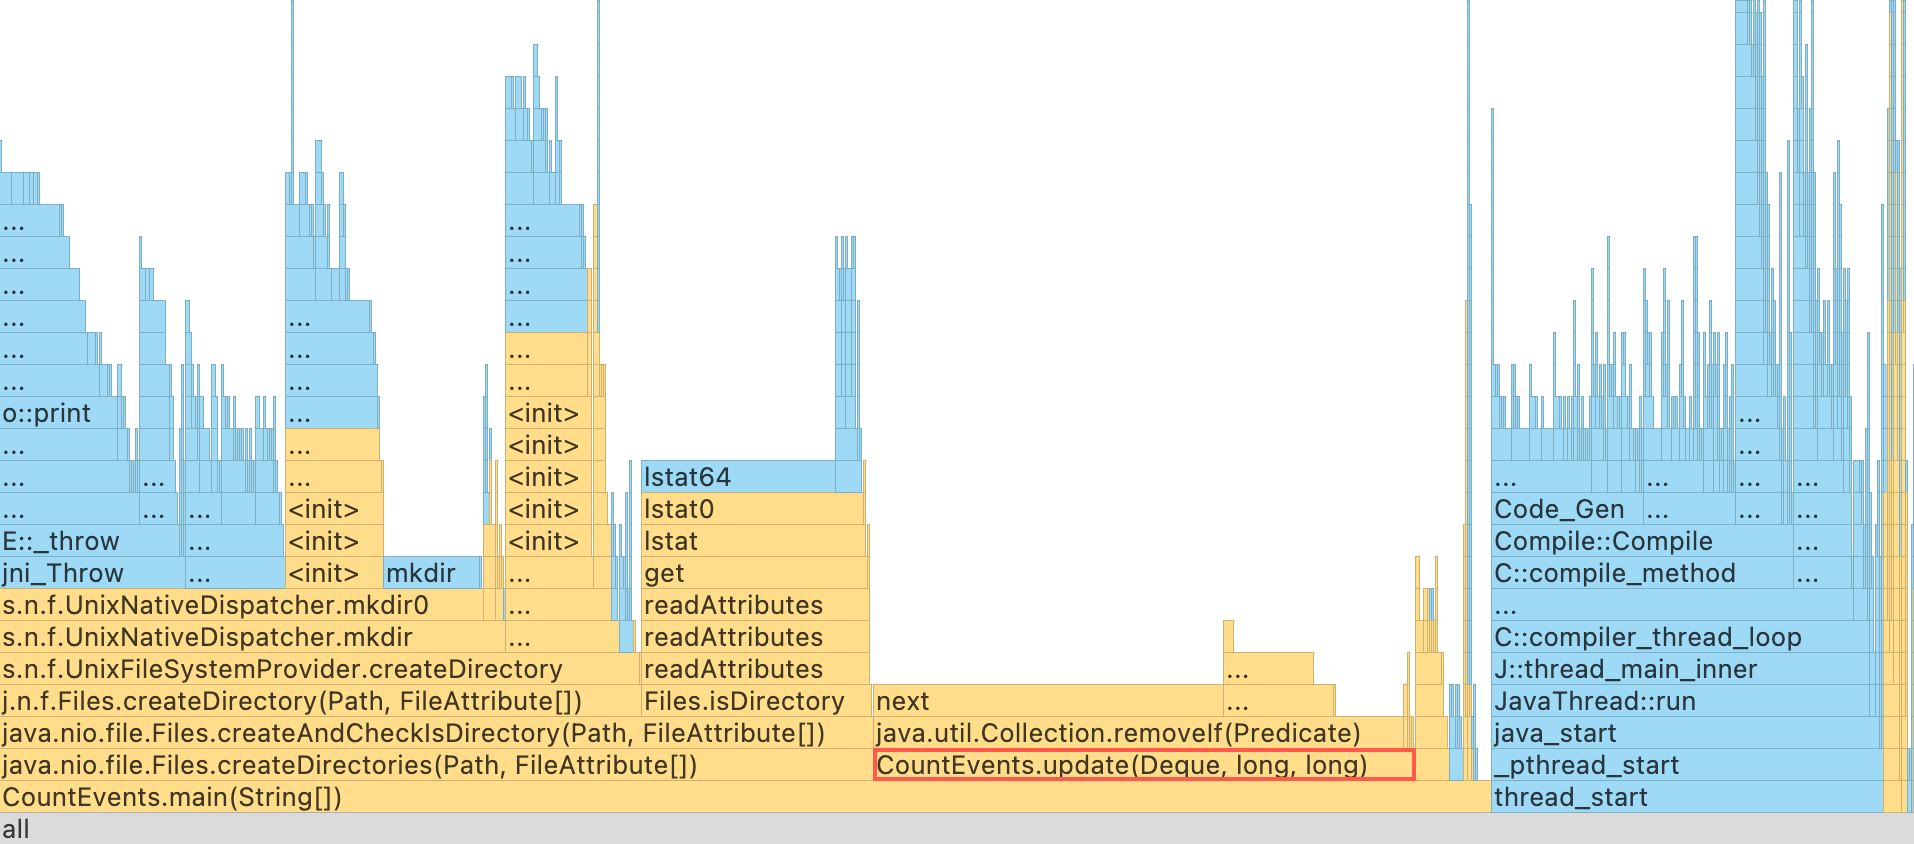
The first thing we see after opening the report is the flame graph. The data on the flame graph is essentially a summary of all sampled stacks. The more samples with the same stack the profiler collects, the wider this stack grows on the flame graph. So, the width of the frame is roughly equivalent to the share of time spent in this state. As for the colors: the yellow part of the stack is Java code, the blue is native method invocations.

To our surprise, the createDirectory() method did not account for the most execution time. Our homemade benchmark took about the same amount of time to execute! Furthermore, if we look one frame above, we see that this is primarily because of the removeIf() method, which accounts for almost all the time of its parent method, update().
This clearly needs some looking into.
public static int update(Deque<Long> events, long nanos, long interval) {
    events.add(nanos);
    events.removeIf(aTime -> aTime < nanos - interval);
    return events.size();
}
Apparently, removeIf() takes so long to execute because it iterates over the entire collection, even though it doesn’t really need to.
Since we’re using an ordered collection, and events are added in chronological order, we can be sure that all elements subject for removal are always at the head of the queue. If we replace removeIf() with a loop that breaks once it starts iterating over events that it is not going to remove, we can potentially improve performance:
while (events.peekFirst() < nanos - interval) {
    events.removeFirst();
}
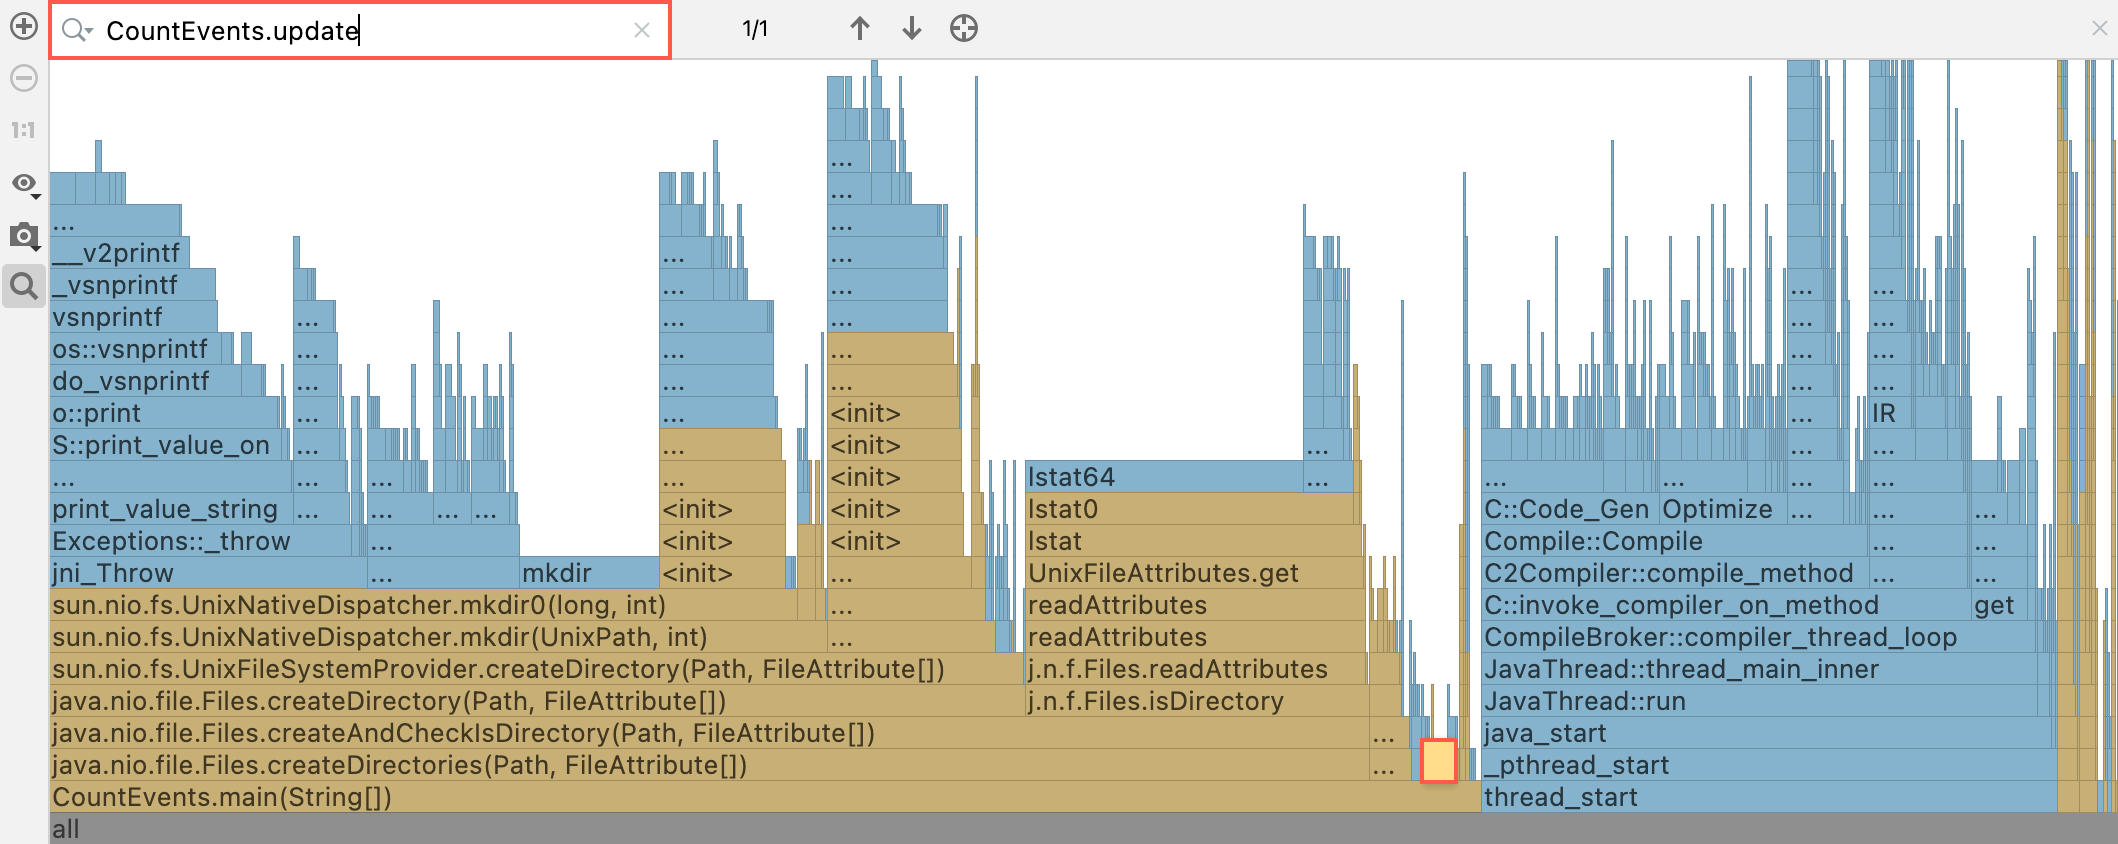
Let’s profile our app once again and look at the result. Use to search the flame graph:

When we search for the update() method, we find out that it has become a tiny little piece on the graph and doesn’t have monstrous overhead anymore. createDirectories() now occupies a more considerable share of application time.
The app also returns nice results figure-wise:
Average count: 9237 op
Spent time: 1090 ms
It’s much better now, isn’t it? Concise and neat as the functional style may be, we should always consider whether it really does what we need. Sometimes, the good old loop can save us tons of precious processor time.
We could stop now and pat ourselves on the back, but what’s going on with our createDirectories() method? Does the flame graph say Exception?
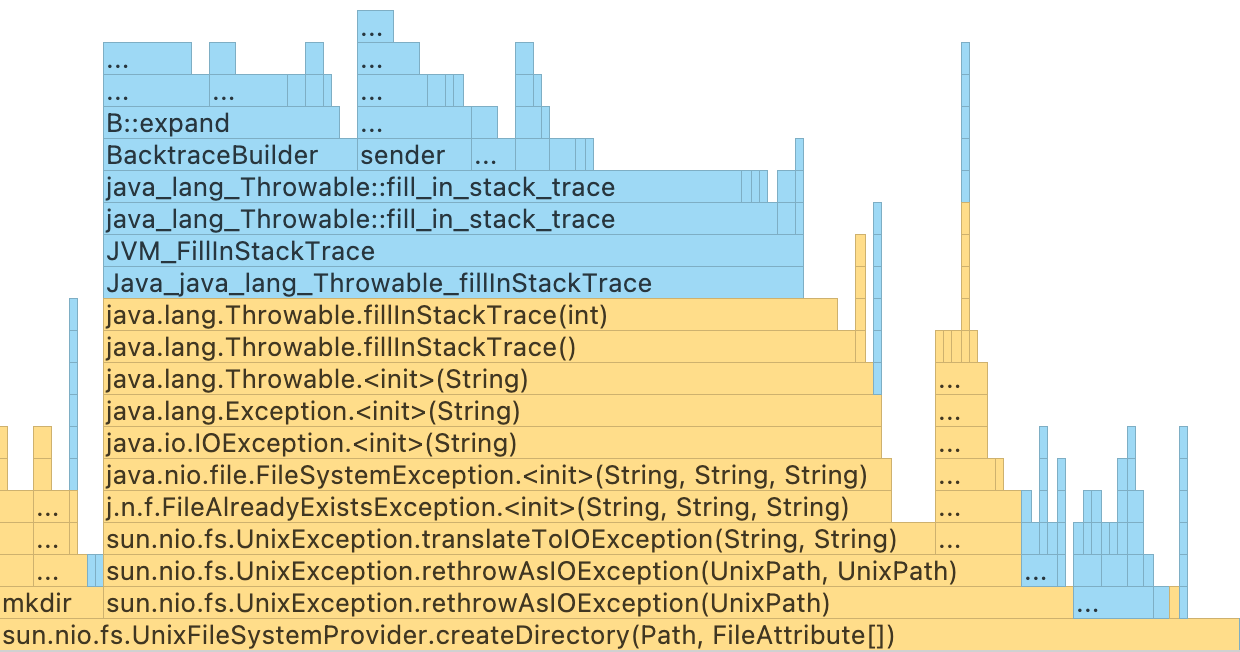
If we examine the top part of the stack where createDirectories() is invoked, we see a lot of native frames that seem to deal with exceptions. But our app didn’t crash, and we didn’t handle any, so why is that happening?

A little more investigation and zooming in gives us the answer. It does not take much Java experience to read the method names on the stack and conclude that the exceptions have to do with attempts to create a file that already exists.
Let’s try to avoid this and wrap the call to createDirectories() in a Files.exists() check:
Path p = Paths.get("./a/b");
if (!Files.exists(p)) {
    Files.createDirectories(p);
}
Whoa! Our code is lightning fast now:
Average count: 48453 op
Spent time: 143 ms
It is now about 21 times faster than it originally was. This exception handling was really expensive! The results may differ on your computer, but they should be impressive anyway.
In this tutorial, we used IntelliJ IDEA profiler to detect and fix a performance problem and witnessed how even a simple piece of code that uses a well-known API may have a real impact on the execution times of your application. We can use the same approach to diagnose both our own and library code should we encounter such a problem in real life.
The tutorial is far from exhaustive: IntelliJ IDEA provides a lot of ways to analyze the profiler report, and the flame graph is only one of them. The range of cases where the profiler may be useful is also immense. If you want to learn more approaches and get more profound knowledge on IntelliJ IDEA, check out the other topics in this section.