Run and debug a Spring Boot application using Docker Compose
You can use IntelliJ IDEA to run and debug a Spring Boot application running in multiple Docker containers under Docker Compose. This tutorial describes how to run two Docker Compose services inside containers in the same virtual network: a simple Spring Boot application and a MySQL database. The application can receive GET requests that add entries to the database. This tutorial also describes how you can set breakpoints and debug your application.
note
Before you begin, install and run Docker, enable the Docker plugin, and connect to the Docker daemon in IntelliJ IDEA. For more information, refer to Getting started with Docker in IntelliJ IDEA.
For features related to Spring, refer to Enable Spring support in IntelliJ IDEA.
The source code of the application is hosted on GitHub at https://github.com/IdeaUJetBrains/SpringBootDockerDemoDebug
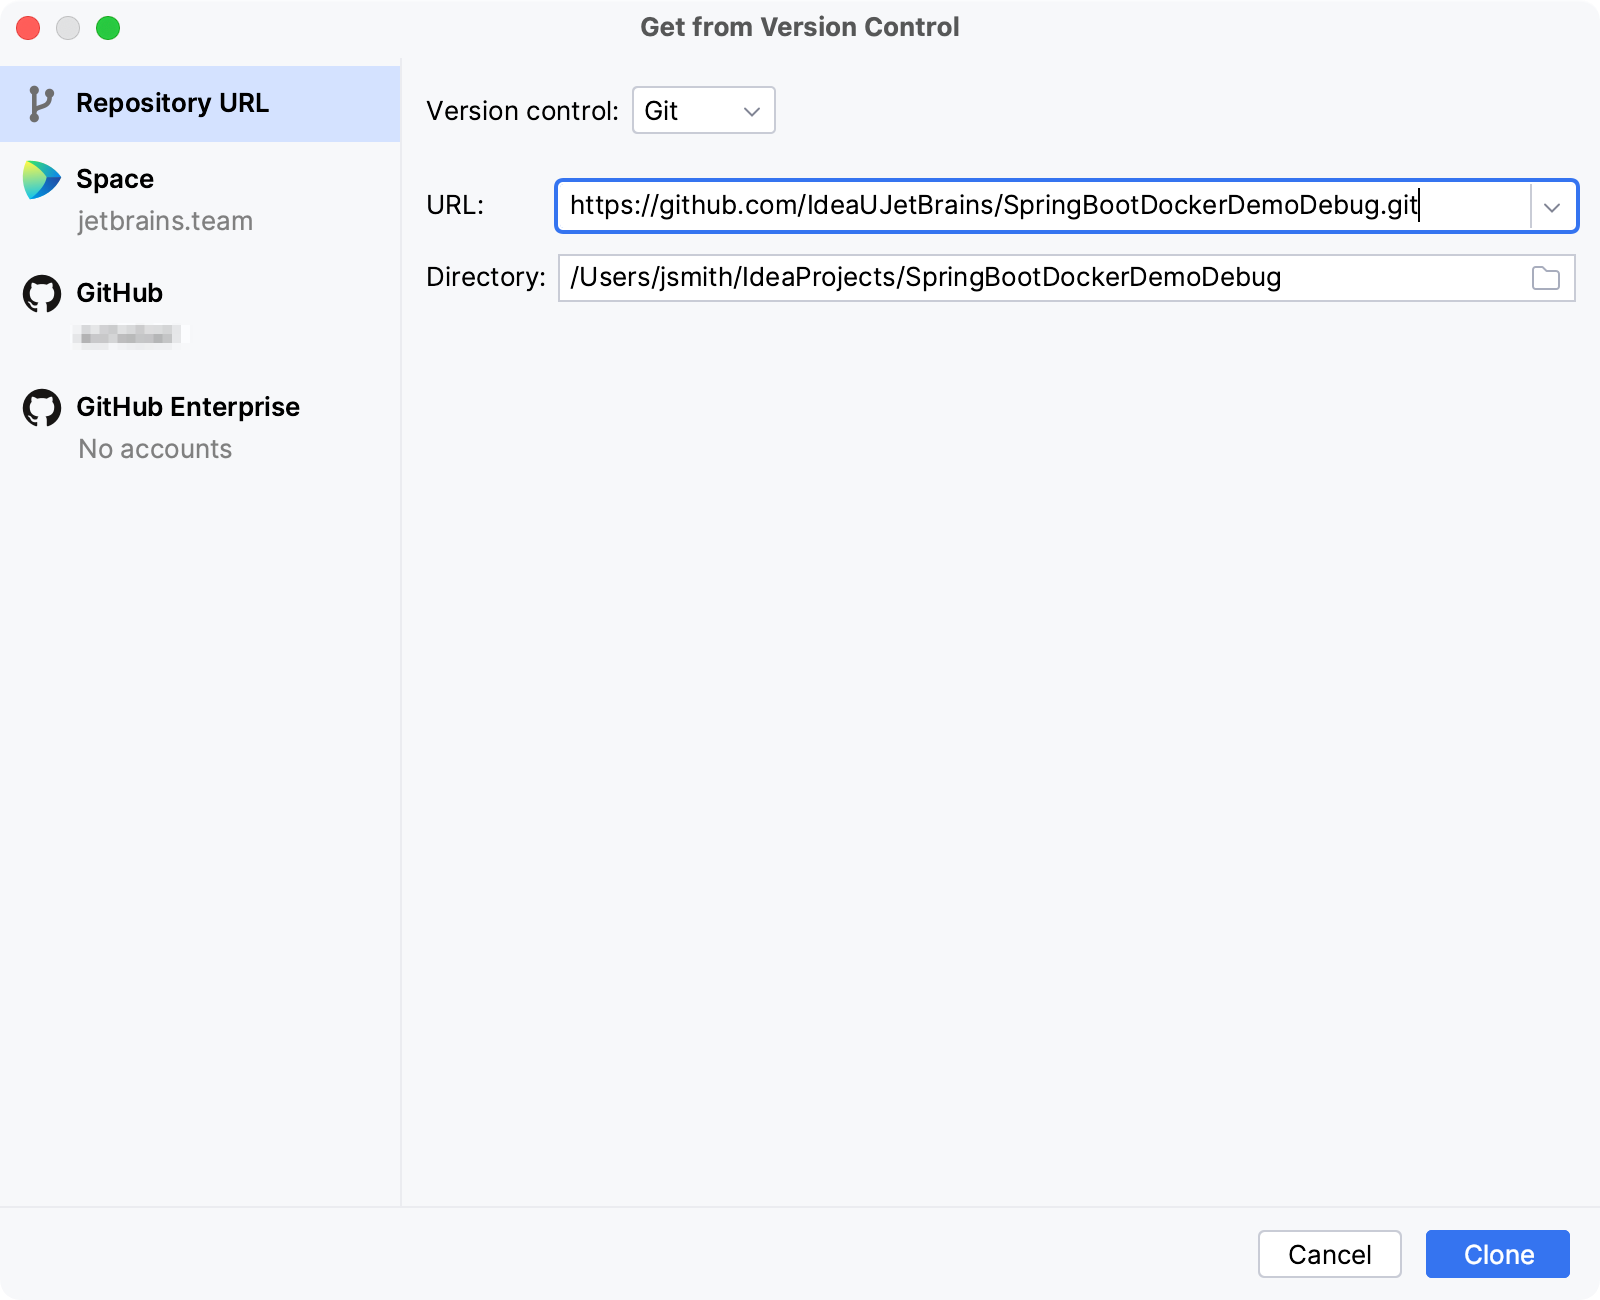
Go to File | New | Project from Version Control.
Specify the URL of the repository and click Clone.
If necessary, agree to open the cloned project in a new window.

The project should have the DemoApplication configuration, which runs the Spring Boot application. By default, it runs locally, but you need to run it on the container from the Docker Compose java service.
note
If you don't have the DemoApplication configuration, open the DemoApplication.java file and click
in the gutter. The application will not actually run without a proper Java runtime and the required database, but this will automatically create the DemoApplication configuration for you.
From the main menu, select Run | Edit Configurations.
In the Run/Debug Configurations dialog, select the DemoApplication configuration, expand the Run on list, and select Docker Compose under Create New Targets.

Select the docker-compose.yml file, then the
javaservice, and click Next.
After IntelliJ IDEA builds the target image and detects the Java home path, click Next.
Check the detected Java home path and version and click Create.
Make sure that the new
javaservice run target is selected and apply the changes to the DemoApplication configuration.
You can configure a run target from a Dockerfile or an image, but in this tutorial we are using Docker Compose to run two services in the same network, so that the Java application in one service can access the database in the other service.
You need to run the database for the application from the db service defined in the same docker-compose.yml file. Create a run configuration for it and then configure to run it before the Spring Boot application.
In the Run/Debug Configurations dialog, click Add New Configuration
and select Docker Compose.
Give this configuration a descriptive name like
DatabaseService, specify the docker-compose.yml file, and then add thedbservice.
Apply the changes to the new configuration and select the DemoApplication configuration.
In the DemoApplication configuration, click Modify options, select Add before launch task, then click Run Another Configuration, and add the new Docker Compose configuration to run the database service before the main application.

After you apply the changes, run the DemoApplication configuration.
When you run the DemoApplication configuration, IntelliJ IDEA will first start the db Docker Compose service and make sure that the database is healthy. Then it will start the java service as a run target for the Spring Boot application. Finally, it will use the Java runtime from the run target for the Spring Boot application. If everything is correct, you should see the following output:

Note the random local port number that Docker forwards to port 8080 in the container where the application is running. In the example above, it is 54123.
You can access the application and list the entities stored in the database at http://localhost:54123/entitybus (replace the port number with whatever Docker assigns in your case).
To add a random entity to the database, send a GET request to http://localhost:54123/entitybus/post.

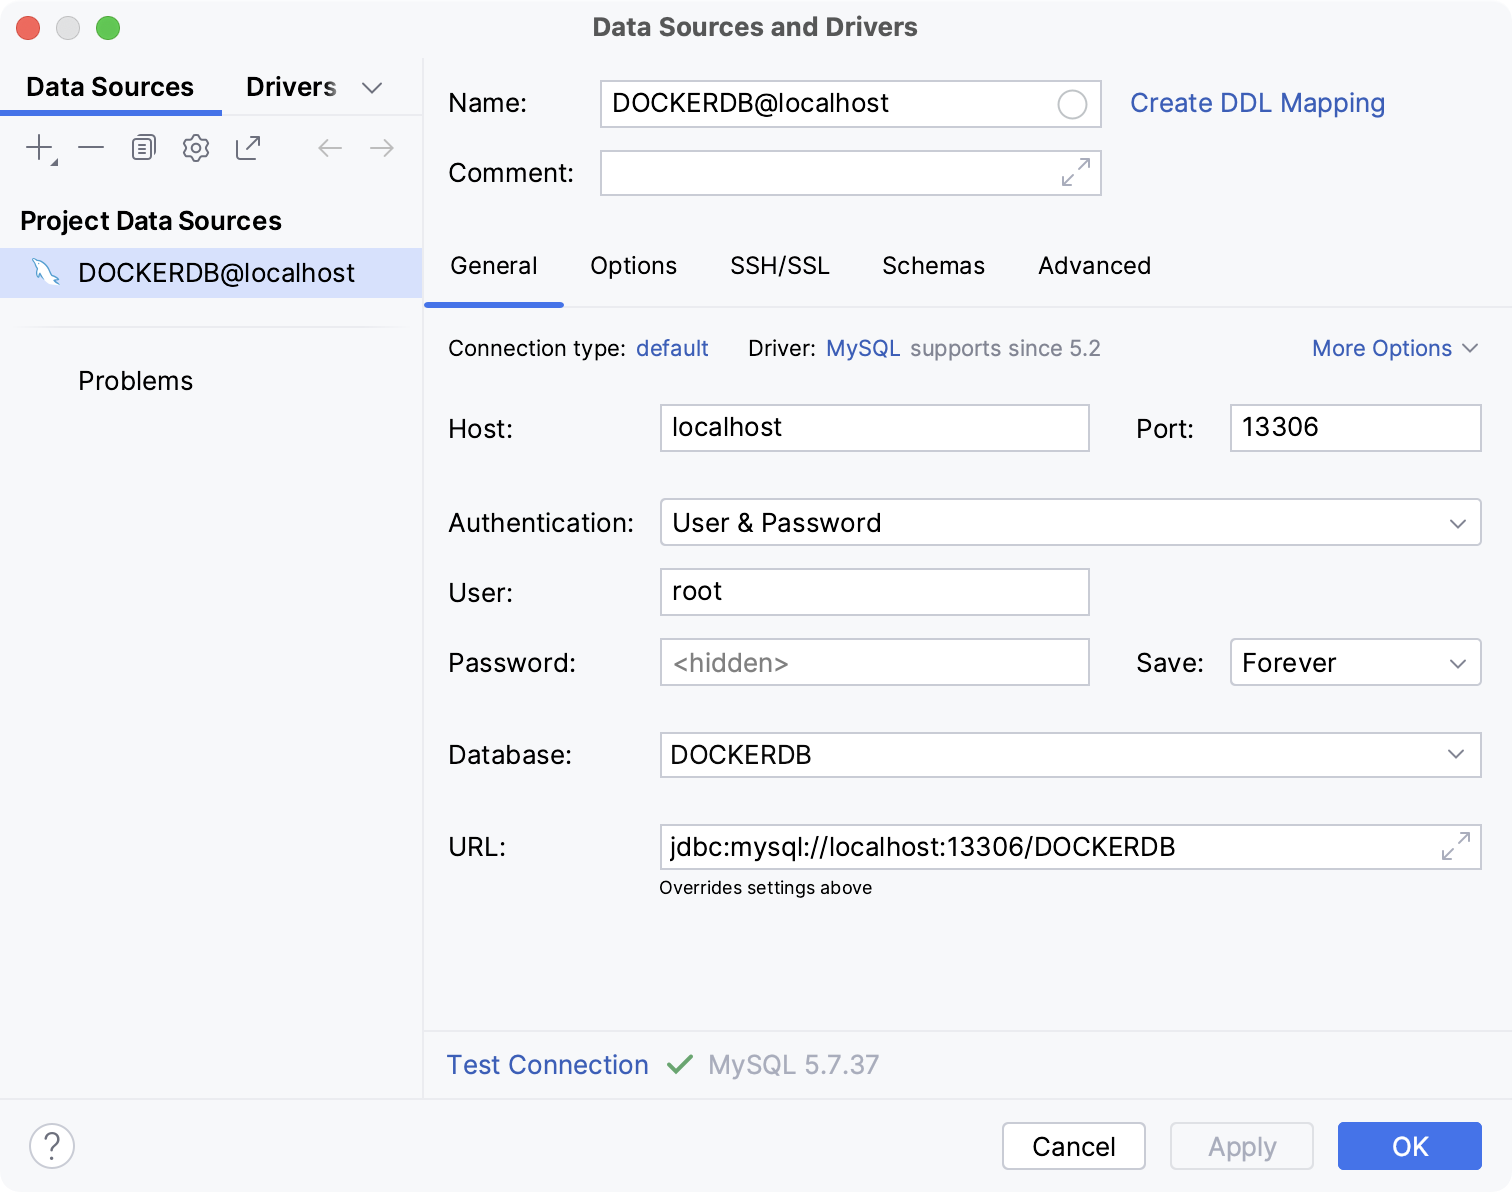
If you want, you can connect to the running database at jdbc:mysql:
Open the Database tool window and add a MySQL data souce with the following settings:
- Host
localhost- Port
13306- User
root- Password
root- Database
DOCKERDB

Run DemoApplication in debug mode. For example, with the run configuration selected, click the Debug button
in the main toolbar.
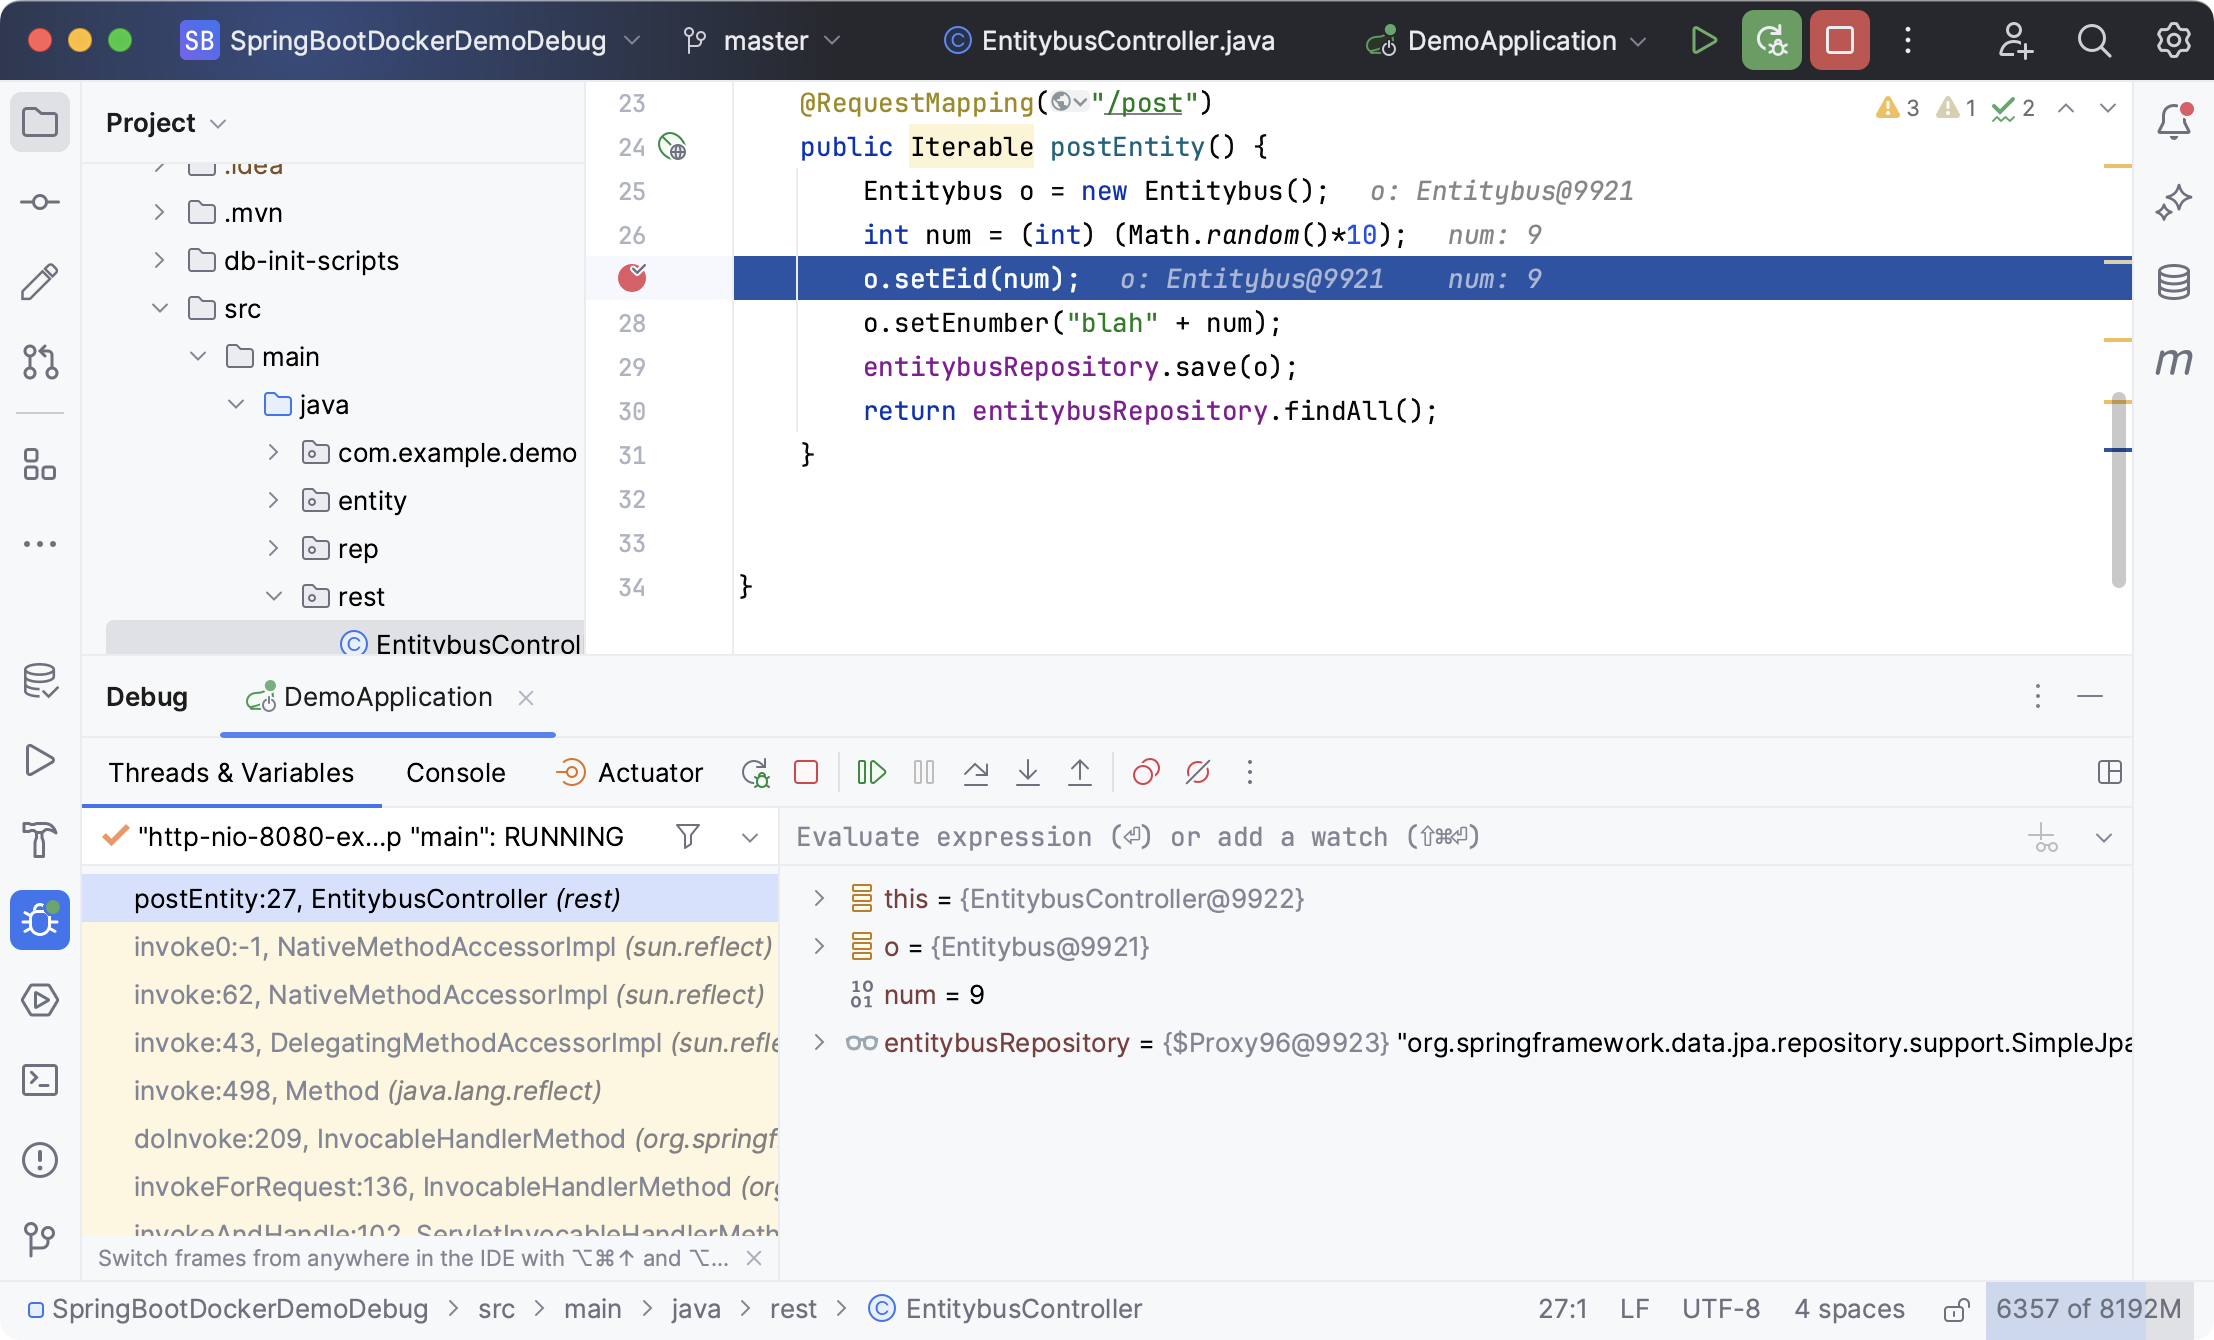
Open the EntitybusController.java file and set a breakpoint somewhere inside the
postEntity()method. For example, on line number 27.Open http://localhost:54123/entitybus/post in your browser (or whatever port Docker assigned in your case).
The debugger should suspend execution at the breakpoint, and you can examine the current state, such as variable values and frames.
