Read the profiler snapshot
Last modified: 29 November 2022The snapshot made with the IntelliJ Profiler configuration contains both CPU and allocation profiling data.
Switch between CPU and allocation data
Use the menu in the top-right corner of the tool window.

IntelliJ IDEA provides several ways to analyze the snapshot for both CPU Samples and Memory Allocations modes:
Flame graph – a convenient way to visually assess the performance of various code paths and their share in overall CPU/memory usage
Call tree – a tree that provides the data about the call hierarchy and the number of samples corresponding to each call
Method list – a flat summary of all methods sorted by sample count
Timeline – a visual representation of threads activity over time. It is helpful for detecting unusual GC activity, multithreading issues such as livelocks, and so on
Navigate the snapshot
You can jump between the tabs while staying focused on a specific method. Right-click the necessary method and select another view in which you want to open it.
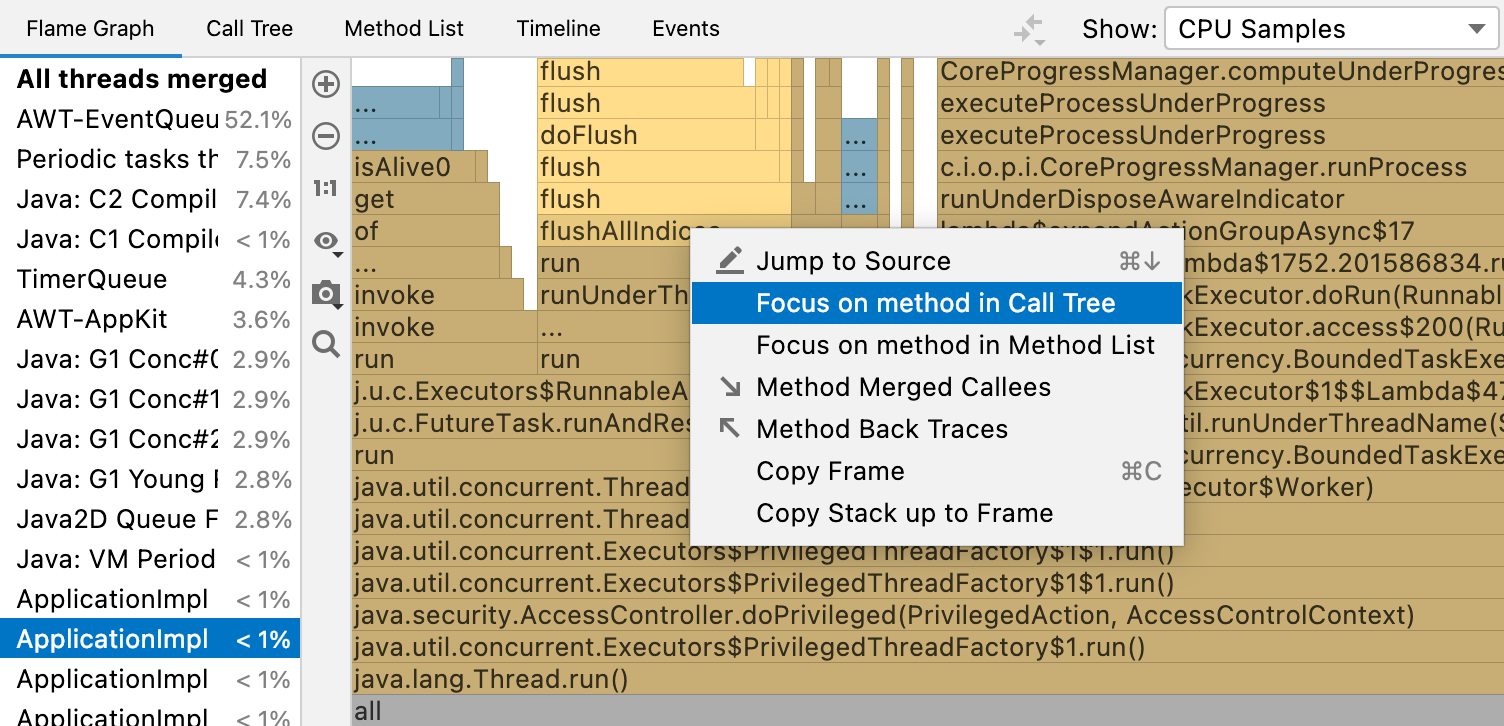
If you want to review the sources in the editor, right-click it on any tab and select Jump to Source or press F4. This will take you to the place where this method is declared.
Threads
The profiling data is grouped by thread. You can select to view merged data for the entire process (All threads merged) or select a specific thread for closer investigation.
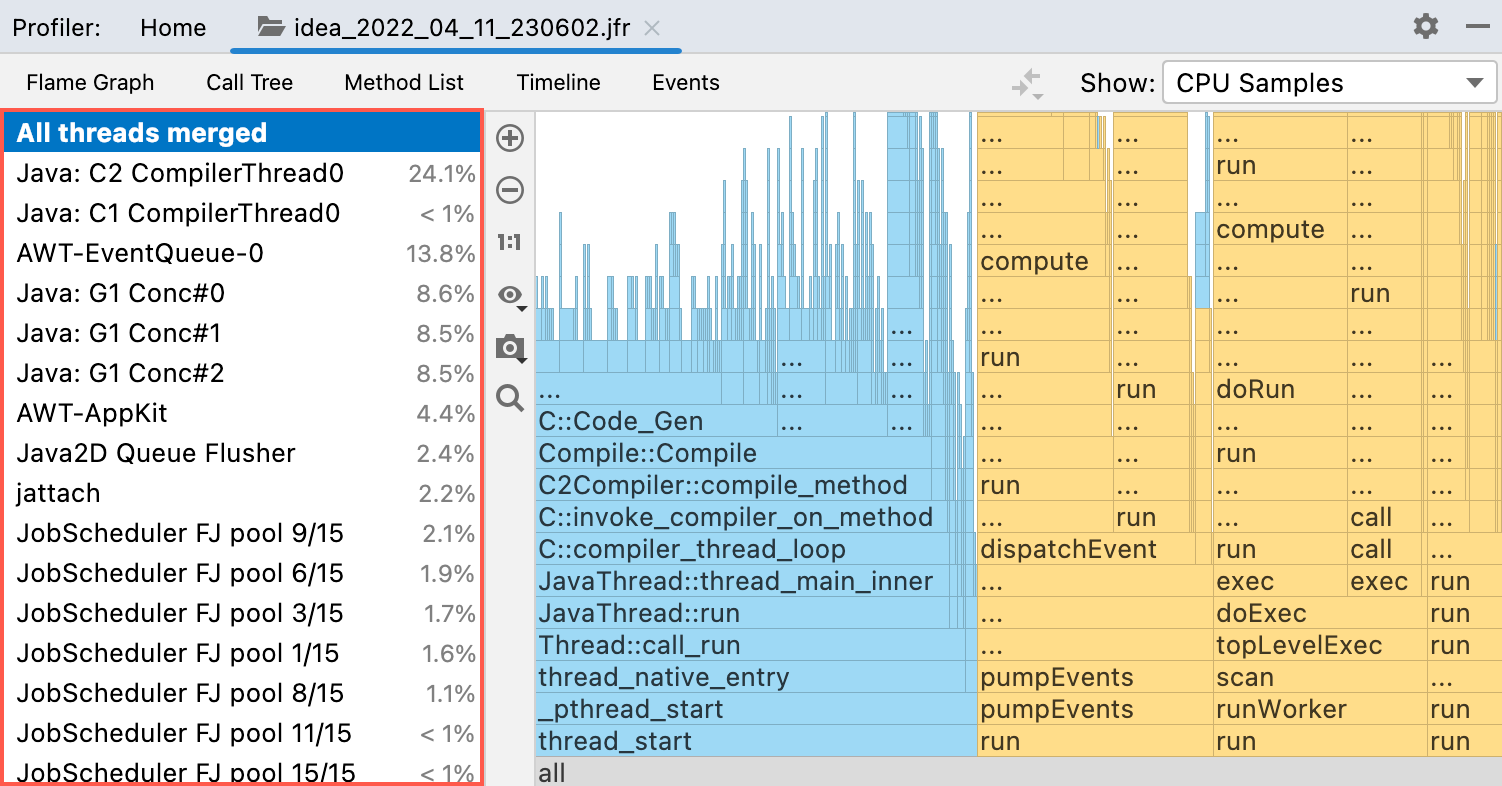
The threads are listed on the left-hand side of the Profiler tool window and sorted by the number of collected samples. Thus, you can find the most busy threads at the top of the list.
Flame Graph
The flame graph visualizes the application call tree with the rectangles that stand for frames of the call stack, ordered by width. Methods that consume more resources are wider than the others.

For example, we can make the following observations from the flame graph above:
The execution time of
main()was contributed to by the methodsa()andb(). In its turna()calledc().c()is mostly adding elements to anArrayList, which could take less time if the capacity of theArrayListwas adequate –addis mostly busy growing the list.Most of the time
b()is processingIndexOutOfBoundsException. It may be a good idea to analyze where these exceptions come from and see if we can do anything about it.
note
The graph only reflects the time spent in a method. It does not preserve the order of events. Thus, the frames that account for larger share of CPU/memory usage appear to the left, regardless of when the respective samples were collected.
The blue color of the blocks stands for native calls, while yellow stands for Java calls.
When you read the flame graph, focus on the widest blocks. These blocks are the methods that are presented in the profile most. You can start from the bottom and move up, following the code flow from parent to child methods, or use the opposite direction to explore the top blocks that show the functions running directly on the CPU. In this case, you can use the |Show Icicle Graph option change the graph view.
Get call details
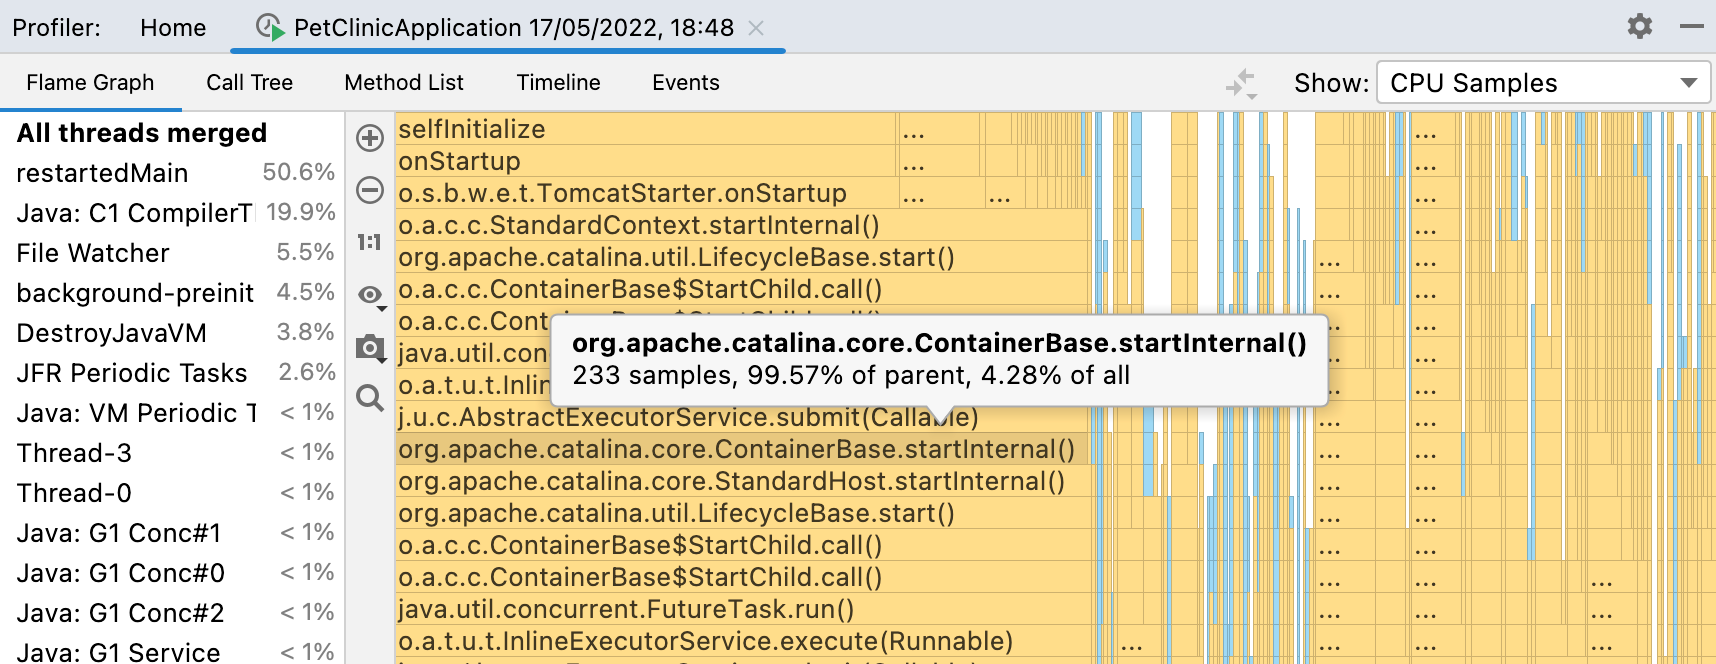
Hover over a block to see a tooltip.

The tooltips show the fully qualified method name, the percentage of the parent sample time, and the percentage of total sample time.
Zoom the graph
Use the
and
buttons or the scroll wheel to zoom the graph.
To focus on a specific method, double-click the corresponding block on the graph.
To restore the original size of the graph, click 1:1.

Set node threshold
It may be hard to tell if a node occupies a considerable share of samples in the snapshot, especially when zoomed in. There is a an option that will help you filter out nodes that are not heavy enough.
Click
and select Show Nodes Filter.
Use the slider to the right of the flame graph. The nodes that do not pass this threshold will appear colorless.

Search the graph
If you want to locate a specific method on the graph, start typing its name or click
and type the name in the search bar.
The graph highlights all blocks with method names matching your search request.

Use
and
for fast navigation between search results. You can also search either in the whole graph or just in a specific subtree.
Capture the graph
You can capture and export the graph separately from other data in the snapshot.
Click
and select Copy to Clipboard or click Save to export the graph as an image in the .png format.
tip
For more information about flame graphs, see Flame Graphs.
Call Tree
The Call Tree tab organizes the sampled data in a tree-like structure.
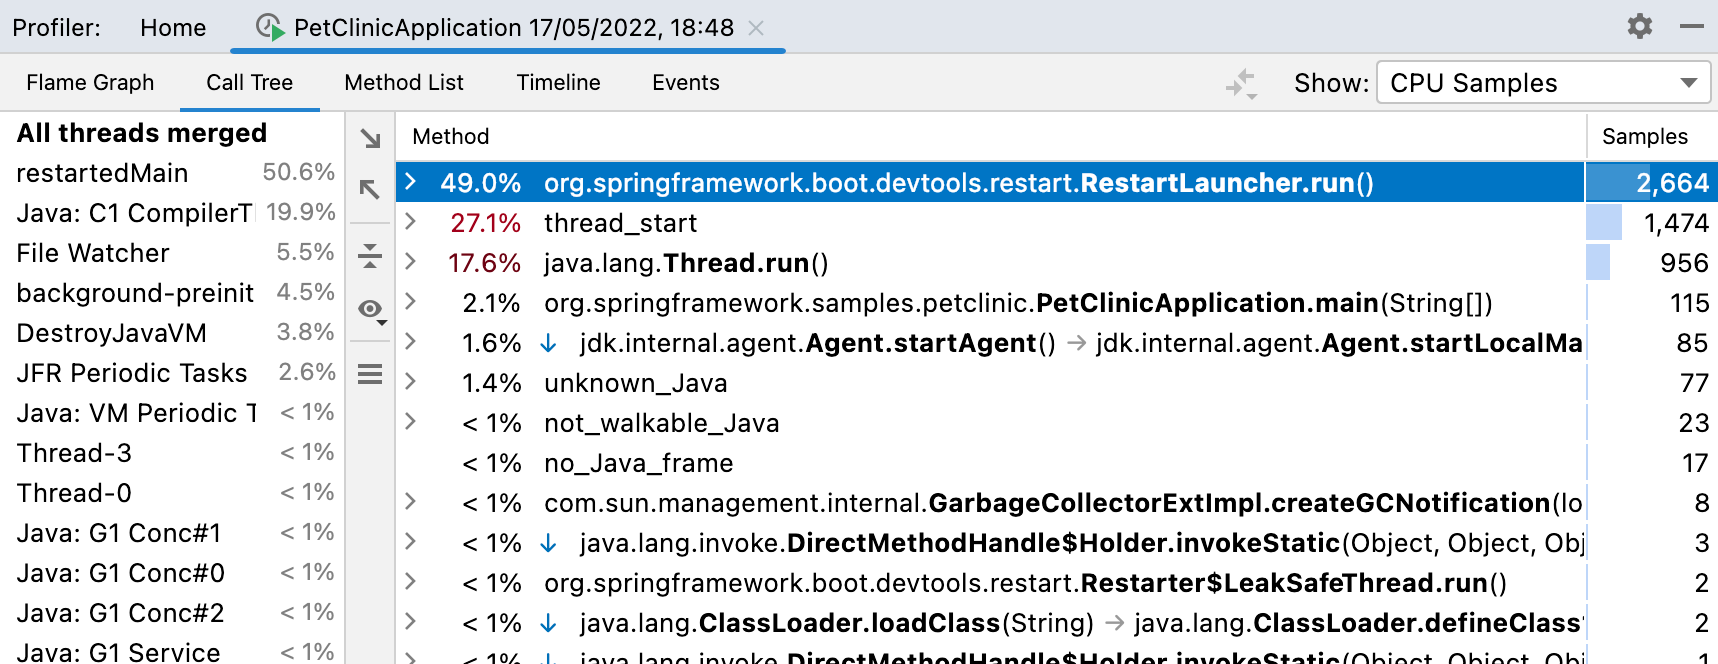
For each method, the tab shows the following information:
Names of methods
Percentage of total samples or parent's samples
The total sample count
By default, the percentage is relative to the total number of samples. You can choose to view the numbers relative to the parent frame.
Switch the percentage between total and parent
Click
and select Show Percent of Total Time or Show Percent of Parent.

Filter Call Tree results
The Call Tree tab allows you to collapse the frames you are not interested in at the moment. For example, you can hide library classes or the classes that come from specific frameworks to focus on the application code.
The blue arrow right after the percentage presents a filtered sequence of calls.
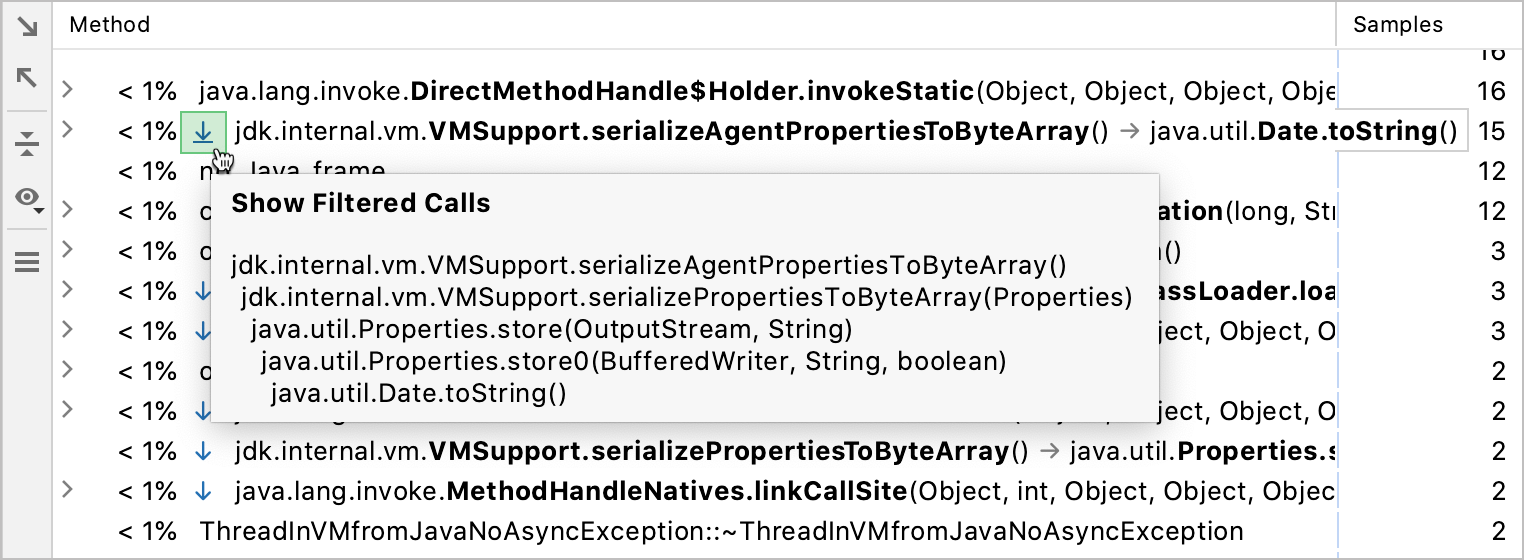
Disable filtering
Click
and deselect the Filter Calls option.
In the Settings/Preferences dialog (Ctrl+Alt+S), select Build, Execution, Deployment | Java Profiler | Filters.
In this dialog, you can modify the existing rules and add new ones.
Configure the packages or specific classes that you want to be able to hide in the output.
To filter all methods in a class, specify the fully qualified class name (for example:
org.bar.ClassName).To filter specific methods in a class, use the following format: fully qualified class name : method name (for example:
* : myMethod()).

Apply the changes and close the dialog.
Collapse recursive calls
A stack that involves recursion may be very difficult to analyze. In a regular Call Tree view, recursive calls are displayed as they are called – one after another, which may lead to almost infinite stack scrolling.
IntelliJ IDEA detects recursion when the same method is called higher up in the call stack. In this case, the subtree is taken out of the call tree and then attached back to the first invocation of that method. This way you can bypass recursion and focus on methods that consume most of the resources and calls that they make.
Collapsing recursive calls allows you to see the total amount of time spent in these calls as if there was no recursion.
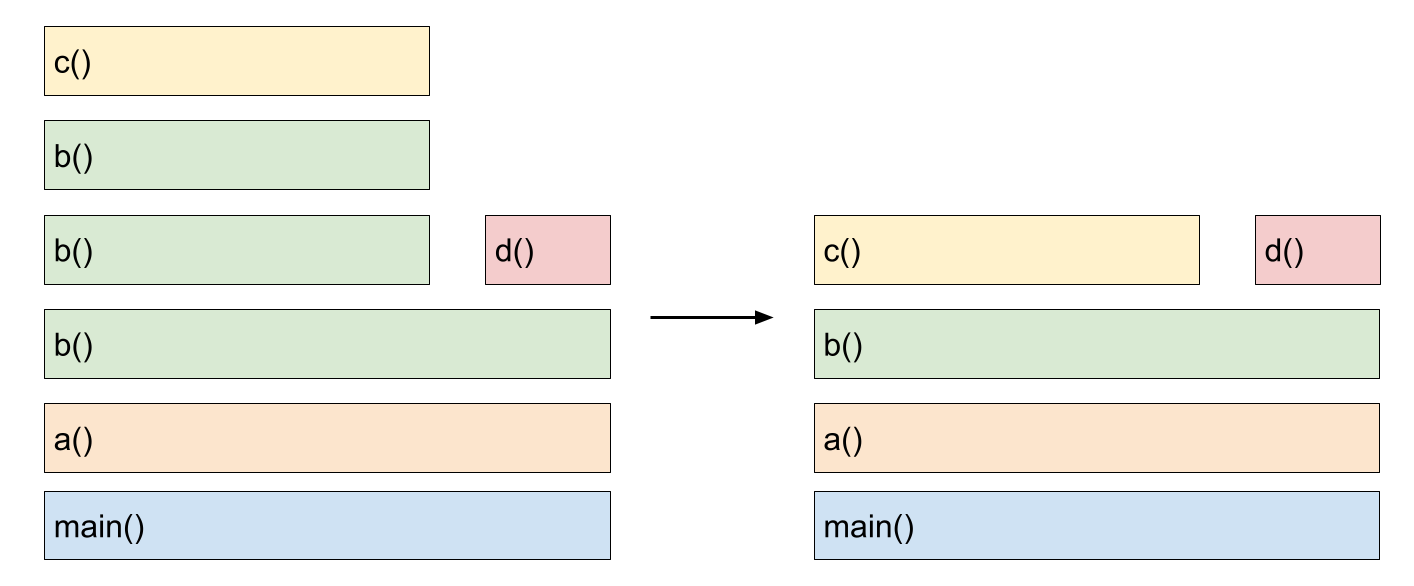
Folded recursive calls are marked with the icon on the Call Tree tab. Click it to open the recursive call tree in a separate tab. You can preview the number of merged calls in a tooltip.

What-if: focus on specific methods
IntelliJ IDEA allows you to examine specific methods in the Call Tree: you can exclude particular methods or other way round, focus only on the methods in which you are interested at the moment.
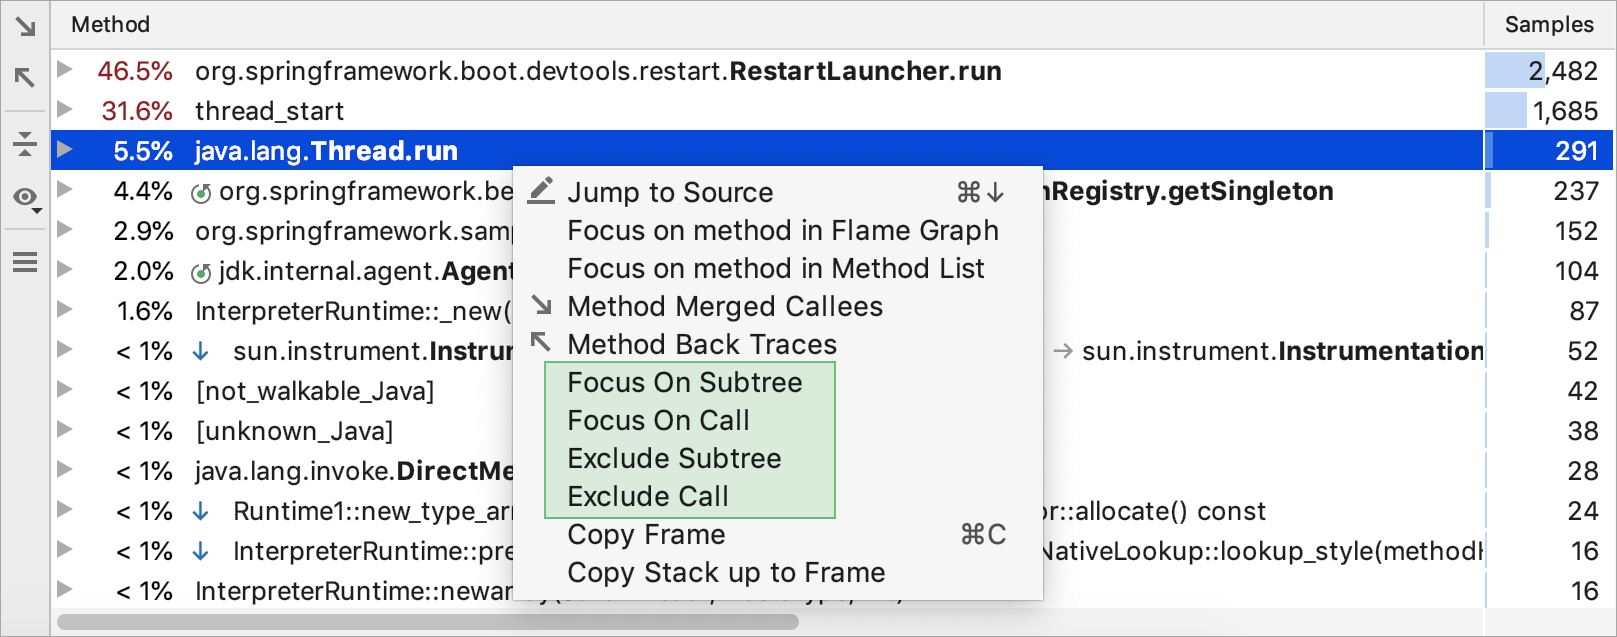
Right-click the necessary method on the Call Tree tab and select one of the following options to open the results in a dedicated tab:
Focus On Subtree: show only the selected method call. Parent method sample counter shows only the time spent in the selected subtree.
Focus On Call: show the selected method and the methods that call it. When this option is enabled, every frame shows only the time spent in the selected method.
Exclude Subtree: ignore the selected method call.
Exclude Call: ignore all calls to the selected method.
Method List
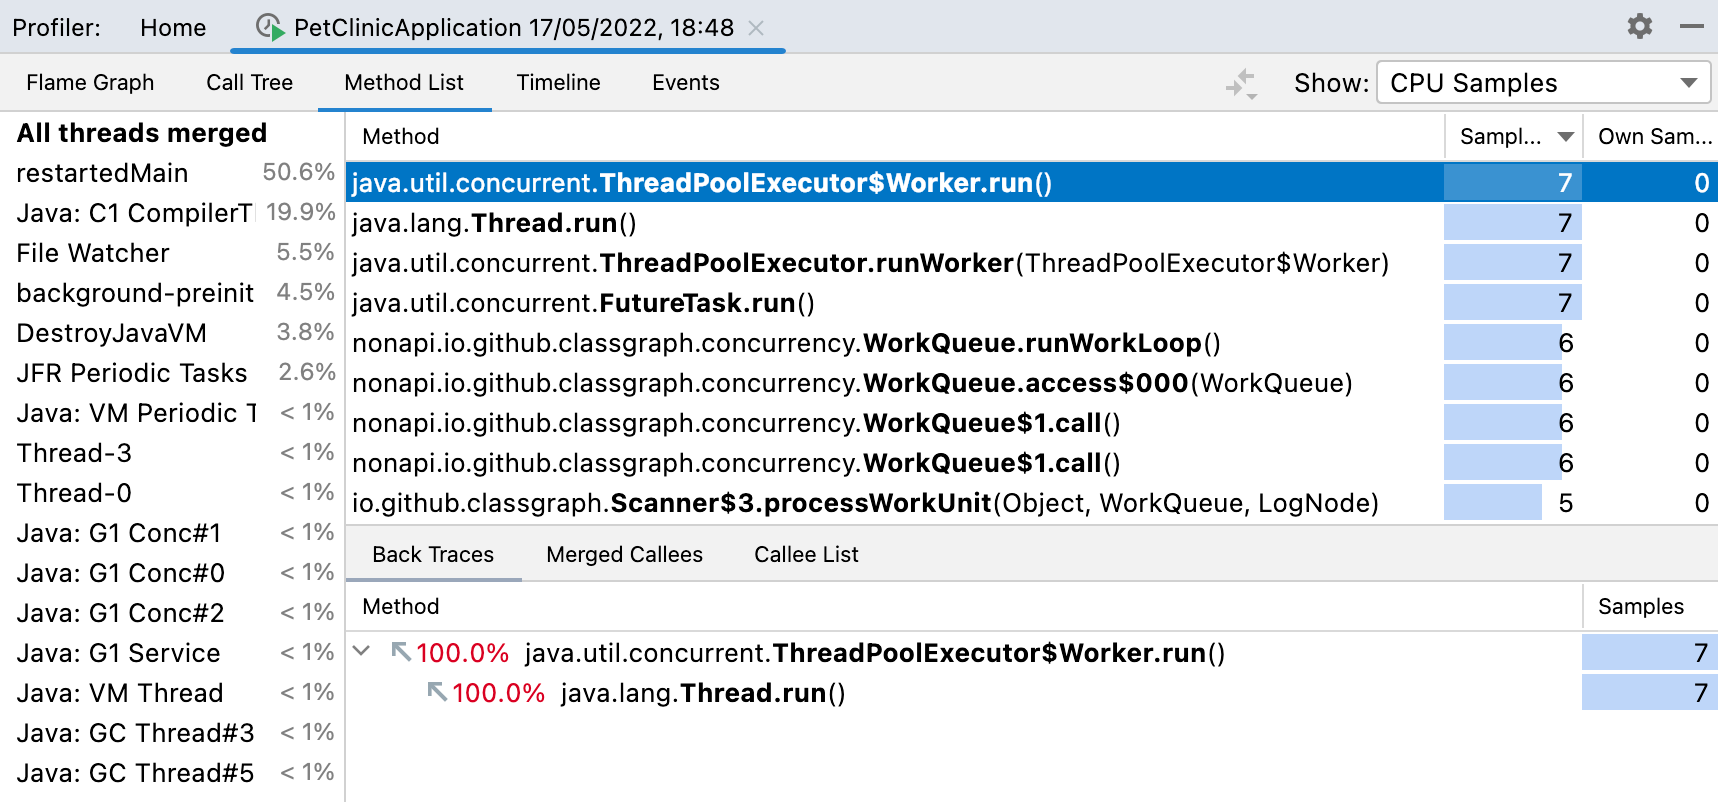
The Method List collects all methods in the profile data and sorts them by cumulative sample time. Every item in this list has several views:
Back Traces shows the hierarchy of callers. Use this view to trace which methods call the selected method.
Merged Callees summarizes all methods that are called by the selected one.
Callee List shows all methods that were called from the selected one.
Timeline
The timeline provides the ability to monitor the activity of individual threads. It visualizes CPU consumption and memory allocation over time, which facilitates identifying critical spots and incorrect behavior.
The toolbar on the left allows you to zoom in and zoom out
the timeline.
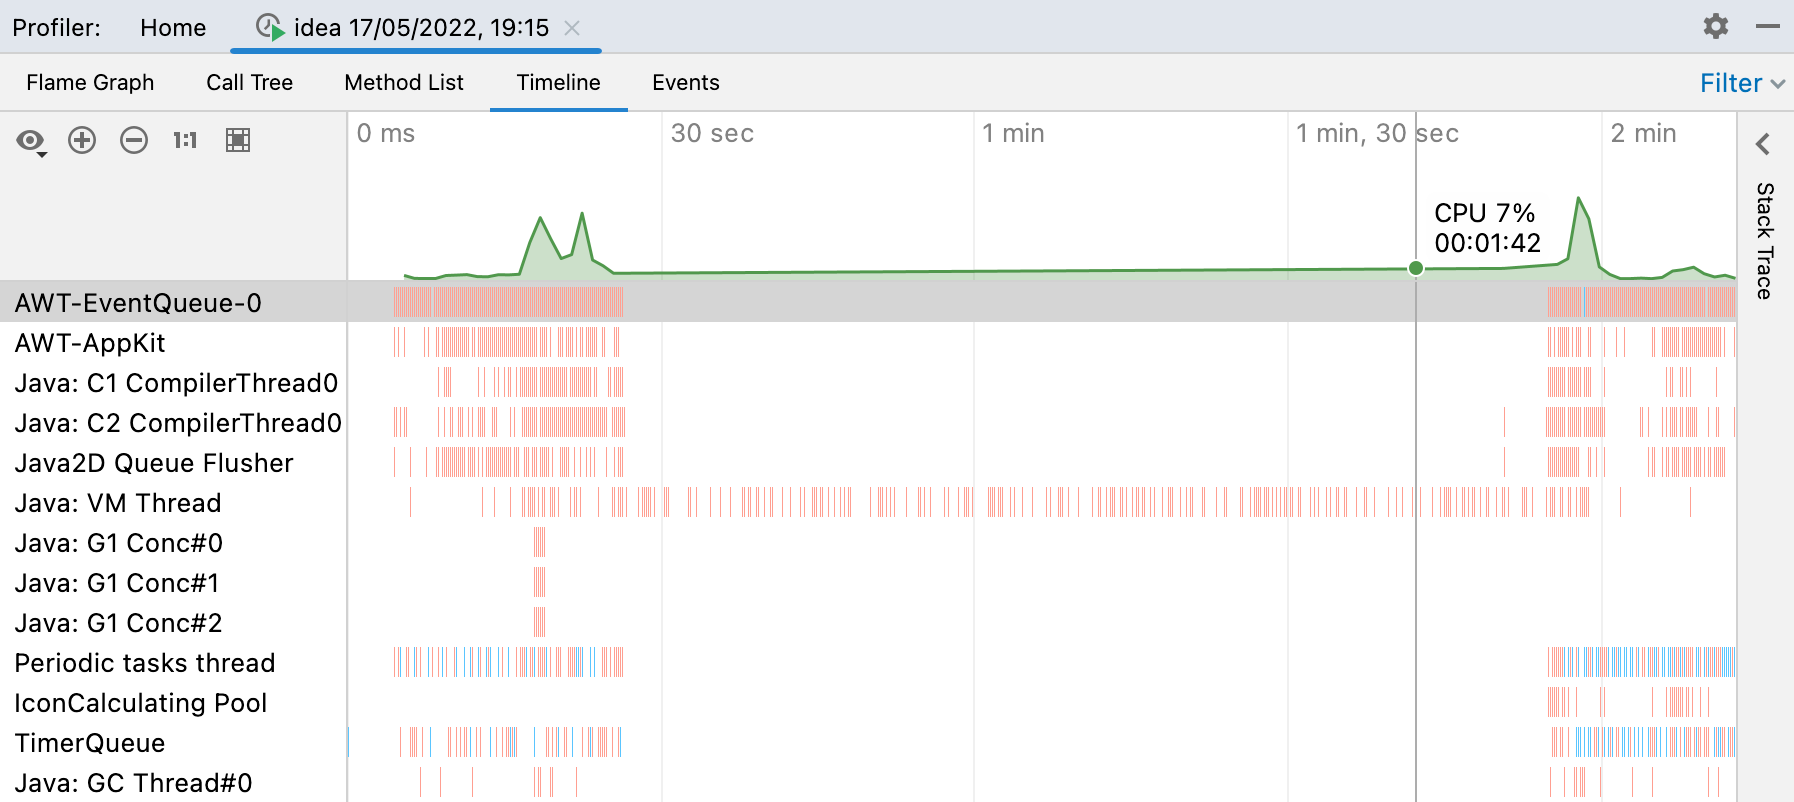
Red vertical bars indicate CPU samples
Blue vertical bars indicate memory allocation
The chart at the top shows JVM load (green) and system CPU load (red dashed line). You can show and hide it with
| Show Chart
Filter events on the timeline
Open the Filter menu in the top-right corner of the tool window and select the types of events that have to be visible.

Get the stacktrace for an event
Click an event on the timeline. The stack trace appears on the right-hand side of the Profiler tool window.

tip
You can navigate to the method declaration by clicking the corresponding stack frame.