UltimateNode.js via SSH
Last modified: 29 November 2022Before you start
Install the Node.js and Node.js Remote Interpreter plugins on the Settings/Preferences | Plugins page, tab Marketplace, as described in Installing plugins from JetBrains repository.
Make sure the FTP/SFTP/WebDAV Connectivity plugin is enabled in the settings. Press Ctrl+Alt+S to open the IDE settings and select Plugins. Click the Installed tab. In the search field, type FTP/SFTP/WebDAV Connectivity. For more details about plugins, see Managing plugins.
Configure access to an SSH server on the target remote host as described in Create SSH configurations and make sure this server is running.
Configure a Node.js interpreter on a remote host accessible via SSH
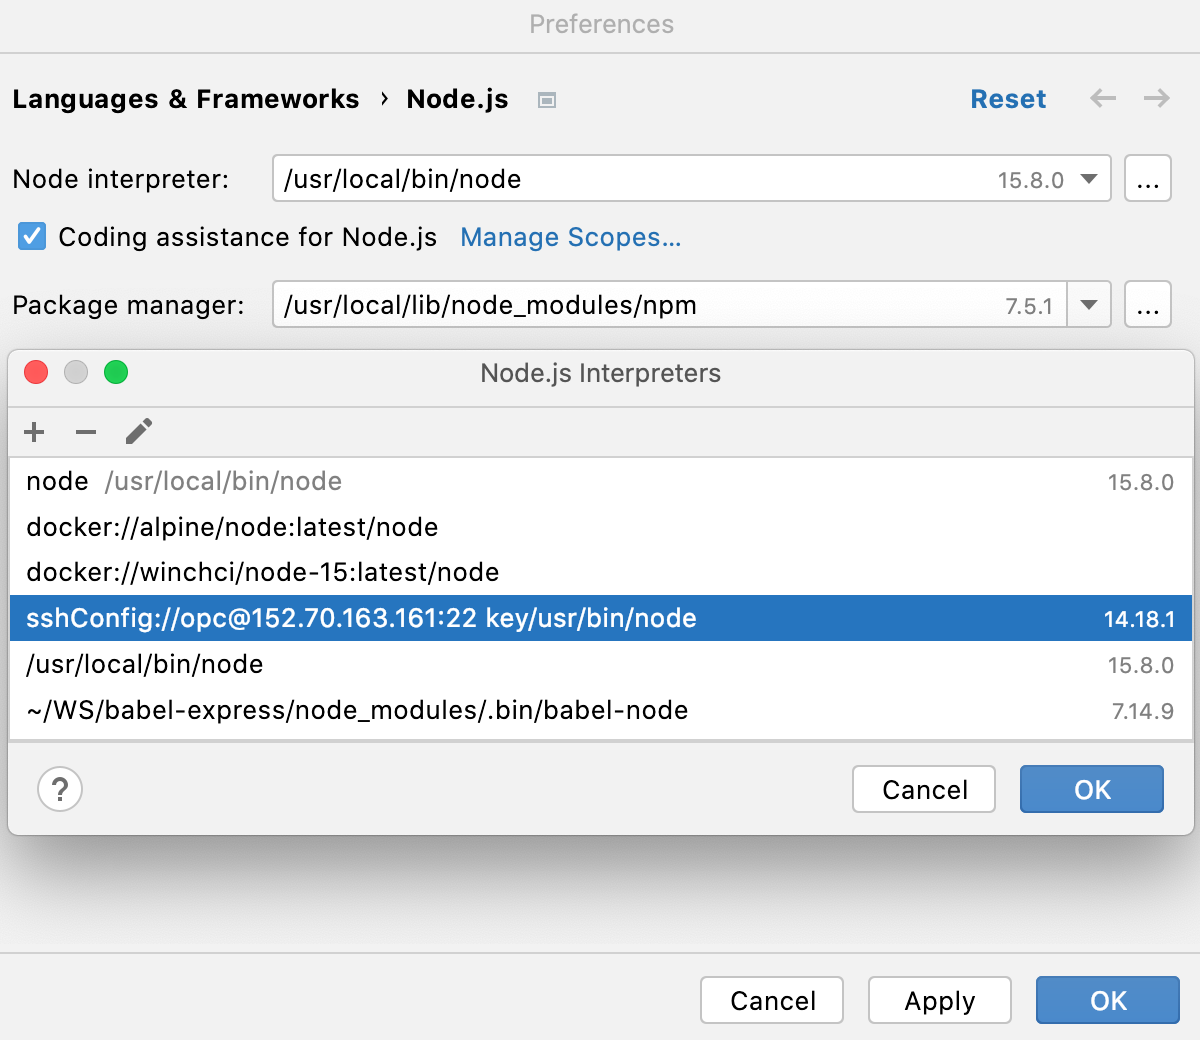
Node.js interpreters via SSH are configured in the Configure Node.js Remote Interpreter dialog. You can open this dialog from the Node.js page of the Settings/Preferences dialog or later, when you create or edit a Node.js run/debug configuration for running or debugging your application.
The recommended way is to configure a remote Node.js interpreter in the Settings/Preferences dialog. In this case you can set the interpreter and the associated package manager as default for your project.
A remote Node.js interpreter that you configure right in the Node.js run/debug configuration can be used only with this run/debug configuration.
Open the Settings/Preferences dialog (Ctrl+Alt+S) and go to Languages & Frameworks | Node.js.
Click
next to the Node interpreter field.
In the Node.js Interpreters dialog with a list of all the currently configured interpreters, click
on the toolbar and select Add Remote from the context menu .

In the Configure Node.js Remote Interpreter dialog that opens, select SSH.
Select an SSH configuration to use.

Alternatively, click
and create a new SSH configuration as described in Create SSH configurations.
Click OK to return to the Node.js Interpreters dialog where the new interpreter is added to the list.

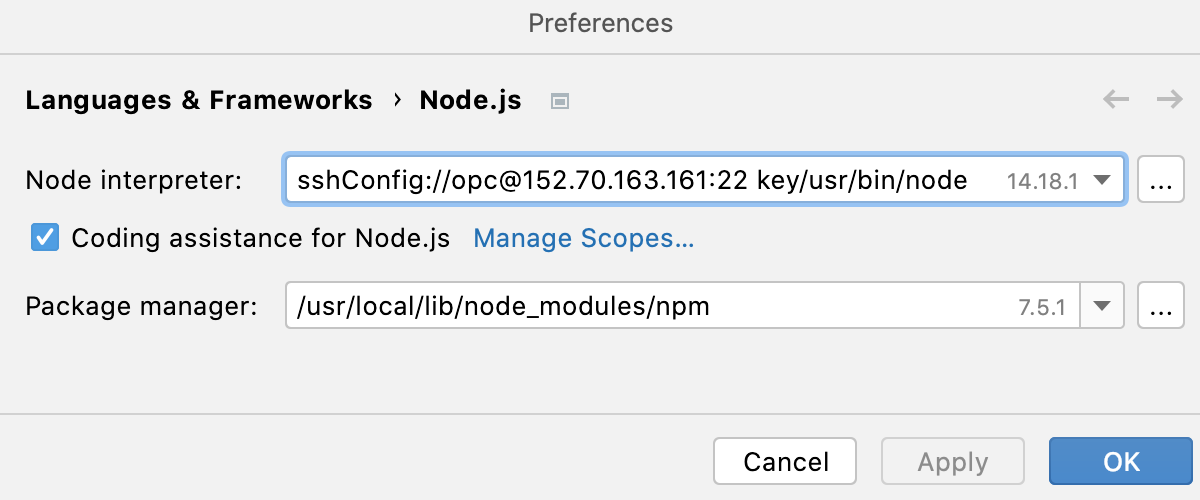
To set the newly configured interpreter as project default, select it in the list and click OK to return to the Node.js dialog.
IntelliJ IDEA automatically uses this interpreter every time you select the
Projectalias from Node Interpreter lists, for example, when creating run/debug configurations.To use the package manager associated with the new interpreter for managing your project dependencies, set this package manager as default in your project. To do that, specify the location of the package manager in the Package manager field.
The default location for npm executable is
/usr/local/lib/node_modules/npm.
Create a Node.js run/debug configuration
From the main menu, select Run | Edit Configurations. In the Edit Configuration dialog that opens, click
on the toolbar and select Node.js from the context menu. The Run/Debug Configuration: Node.js dialog opens.
In the JavaScript File field, specify the path to the main file of the application that starts it (for example, bin/www for Express applications).

If necessary, specify some optional settings as described in Running and debugging Node.js applications.
From the Node interpreter list, select the relevant remote Node.js interpreter accessible vis SSH.

Alternatively, Click
next to the Node interpreter field and configure a remote Node.js interpreter as described above.
Map the local folders with the folders on the remote host.
Click
next to the Path mappings field or press Shift+Enter.
In the Edit Project Path Mappings dialog that opens, click
on the toolbar.

Specify the paths to the local folders and the corresponding folders on the remote host. For example, you can map the project folder to
/home ./opc 
When you click OK, you return to the Run/Debug Configurations dialog where the new mapping is shown in the Path mappings field.

Run your application
Create a Node.js run/debug configuration as described above.
From the Select run/debug configuration list on the toolbar, select the newly created Node.js configuration.
Click
next to the Select run/debug configuration list.
Debug your application
Set the breakpoints in the Node.js code as necessary.
Create a Node.js configuration as described above, select it from the Select run/debug configuration list on the toolbar, and click
next to the list.
Proceed as when starting the debugger together with a Node.js application locally.