Tutorial: Remote debug
Last modified: 01 August 2022In this tutorial, we'll learn how to attach to a local or remote process using the IntelliJ IDEA debugger.
Create a project
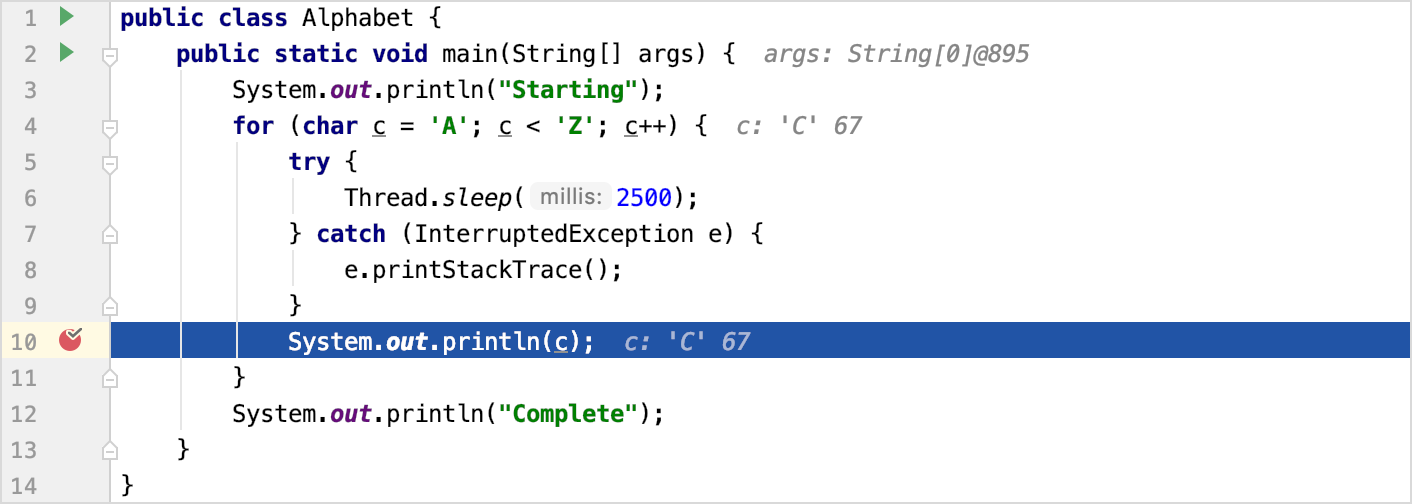
First, let's set up the project that we'll be debugging (a simple program that outputs the capital letters from A to Z).
tip
You can use your own project instead of the one created in this chapter. If you do, make sure that:
the app is compiled with debug information. This is the default compiler setting and must not be overridden. Otherwise, most of the debugger functionality will be unavailable.
you have the source code of the application. While it is possible to use decompiled code for debugging, it is more complicated and not covered in this tutorial.
Create a class named
Alphabet.
In the body of the
Alphabetclass, paste the following definition of themainmethod:public static void main(String[] args) { System.out.println("Starting"); for (char c = 'A'; c < 'Z'; c++) { try { Thread.sleep(2500); } catch (InterruptedException e) { e.printStackTrace(); } System.out.println(c); } System.out.println("Complete"); }
Create run configurations
To allow the debugger to attach, we need to run the application with special parameters (more on them shortly). In this tutorial, we'll set up a run/debug configuration that will do this for us. This way, we are going to have two run/debug configurations: one for running the app and another for attaching to it.
tip
Though we are running and debugging the application on the same machine, the steps are the same for debugging an application that is indeed remote.
Set up the debugger
First, we need to set up the run/debug configuration that will be used for attaching to the host application.
From the main menu, select Run | Edit Configurations or press Alt+Shift+F10 then 0.
In the Run/Debug Configurations dialog, click the Add New Configuration button
and select Remote.

Configure/use the following properties:
Name: configure how this run configuration will be called. The name can be anything, including the default value.
Host: the address of the machine where the host app will run. Since we are running it on the same machine, it needs to be localhost. If the program was running on another machine, we would specify its address here, for example: 192.168.17.43.
Command line arguments for remote JVM: the VM options that the host application needs to be started with. We will use them in the other run/debug configuration. You can copy them now or get back to this field later.

Click Apply.
Set up the host app
There are no restrictions on how exactly the host application needs to be run. For example, you can package the app as a JAR and run it using the following command line:
java -jar -agentlib:jdwp=transport=dt_socket,server=y,suspend=n,address=*:5005 remote-debug.jarnote
For the purposes of debugging, there is no difference how we run the application as long as it gets the VM options that start the program with the debug agent.
In this tutorial, we are going to use a run/debug configuration that will do the most of work for us.
Right-click anywhere in the body of the
Alphabetclass. Select More Run/Debug, then Modify Run Configuration.Click Modify options, then select Add VM options. In the VM options field, paste the options that you copied from the debug configuration.

Click Apply.
Run the app
Now that we prepared all that is necessary, we can proceed with running our application.
Press Alt+Shift+F10 and select
Alphabet.
In the program output, the first line will be:
Listening for transport dt_socket at address: 5005This indicates that we have enabled the debug agent and our program is ready to accept incoming debugger connections.
Attach to process
Click the gutter at line 10 to set a line breakpoint there.

Press Alt+Shift+F9 and select your remote debug configuration.

As the result, the program is suspended at the breakpoint, and you can perform any debugging actions like stepping, expression evaluation, and so on.

The debugging process is the same regardless of how and where your app is launched. After you have connected, you can use the same debugger features as if you were launching your app right from IntelliJ IDEA.
Close the debug session
Close the corresponding session tab in the Debug tool window.

Select if you want to terminate the process or disconnect from it.
Disconnect stops the debug session and the process continues to run.
Terminate stops both the process and the debug session.
