UltimateRead the profiling report
Last modified: 01 August 2022In the Profiler tool window, the collected data is presented on several tabs: Flame Graph, Call Tree, Method List, Timeline, and Events (for JFR). The left-hand part of the tool window lists application threads. By clicking on each thread you can go in more details.
Navigate the report
The Profiler tool window allows you to jump between the tabs while staying focused on a specific method. Right-click the necessary method and select another view in which you want to open it.
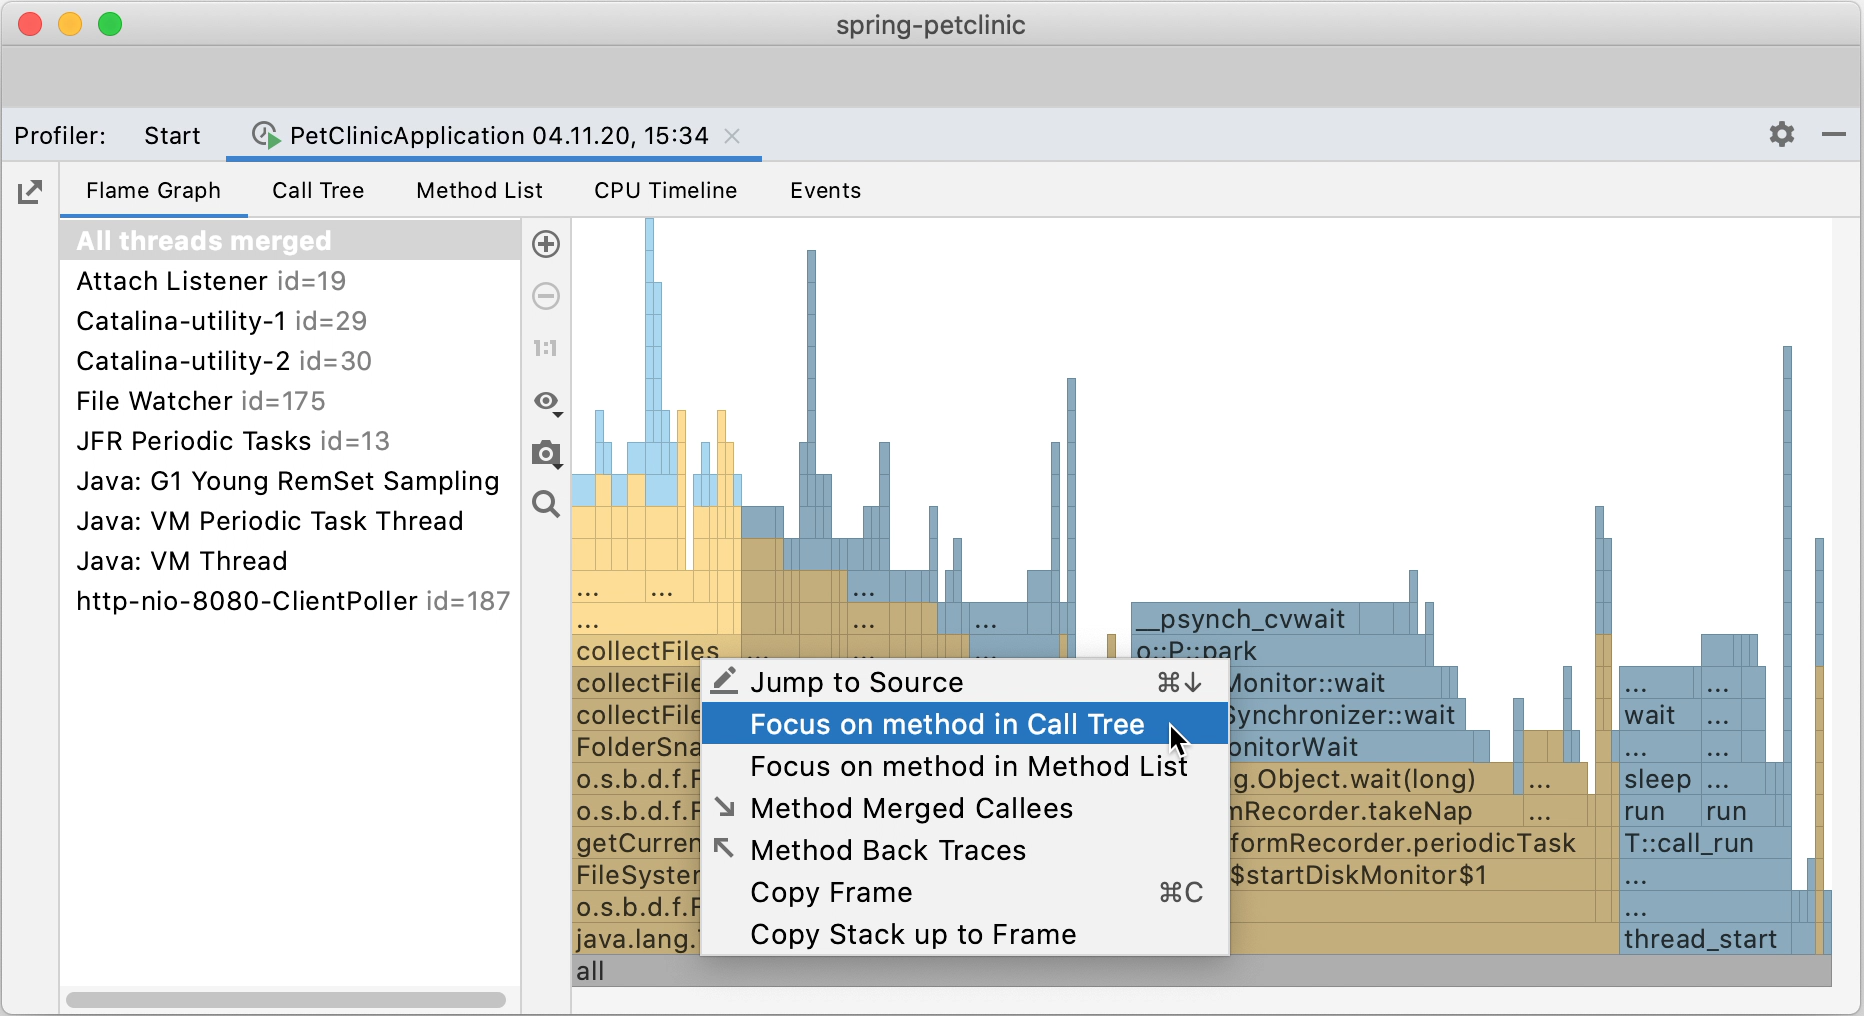
For a method on any tab, you can open the Merged Callees and Back Traces trees. Right-click the method and select Method Merged Callees or Method Back Traces respectively.
If you want to review a method in the editor, right-click it on any tab and select Jump to Source or press F4.
You can import profiling data to the IDE for analysis using the profiling tools. Make sure that the files that you import were created in Async Profiler or have the .jfr extension.
From the main menu, select View | Tool Windows | Profiler and click Open Snapshot.
Alternatively, from the main menu, select File | Open or drag the necessary file from your system file manager to the editor.
Flame Graph
The flame graph visualizes the application call tree with the rectangles that stand for frames of the call stack, ordered by width. Methods that consume more CPU time and memory resources are wider than the others.
The blue color of the blocks stands for native calls, yellow stands for Java calls.
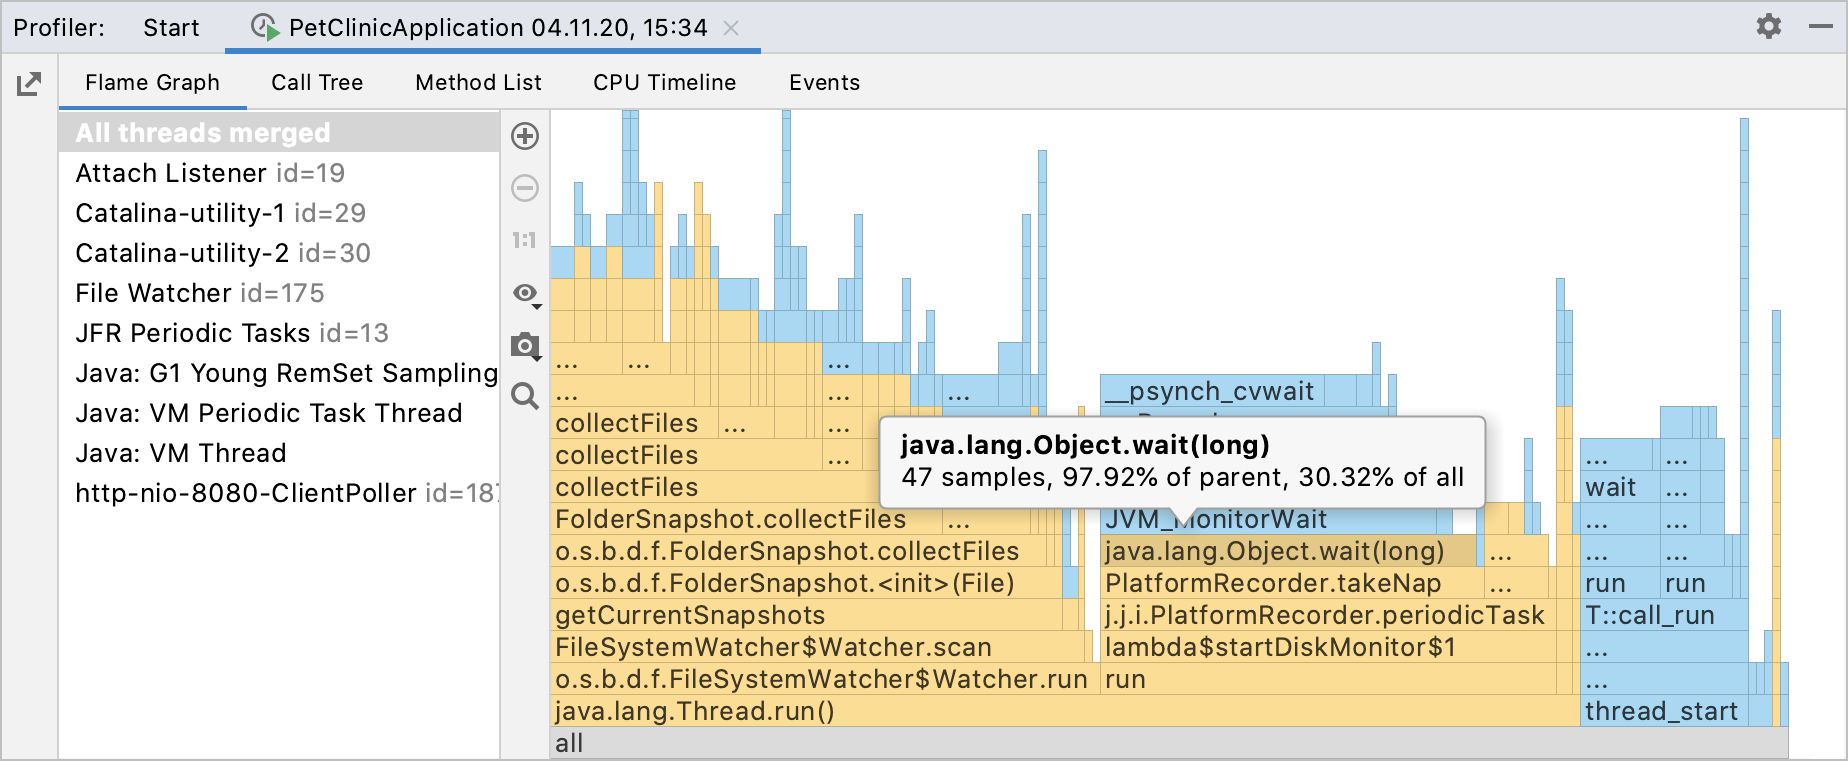
When you read the flame graph, focus on the widest blocks. These blocks are the methods that are presented in the profile most. You can start from the bottom and move up, following the code flow from parent to child methods, or use the opposite direction to explore the top blocks that show the functions running directly on the CPU. In this case, you can use the |Show Icicle Graph option change the graph view.
Flame Graph layout
Each block represents a function in the stack (a stack frame). The width of each block corresponds to the method’s CPU time or memory used (or the allocation size, in case of allocation profiling).
On the Y-axis, there is a stack depth going from bottom up. The X-axis shows the stack profile sorted from the most resource-consuming functions to the least consuming ones.
Show details in tooltips
Hover the mouse pointer over a block to display a tooltip.
The tooltips show the fully qualified method name, the percentage of the parent sample time, and the percentage of total sample time.
Zoom the graph
Use the
and
options to zoom the graph.
To focus on a specific method, double-click the corresponding block on the graph.
To restore the original size of the graph, click 1:1.
Search the graph
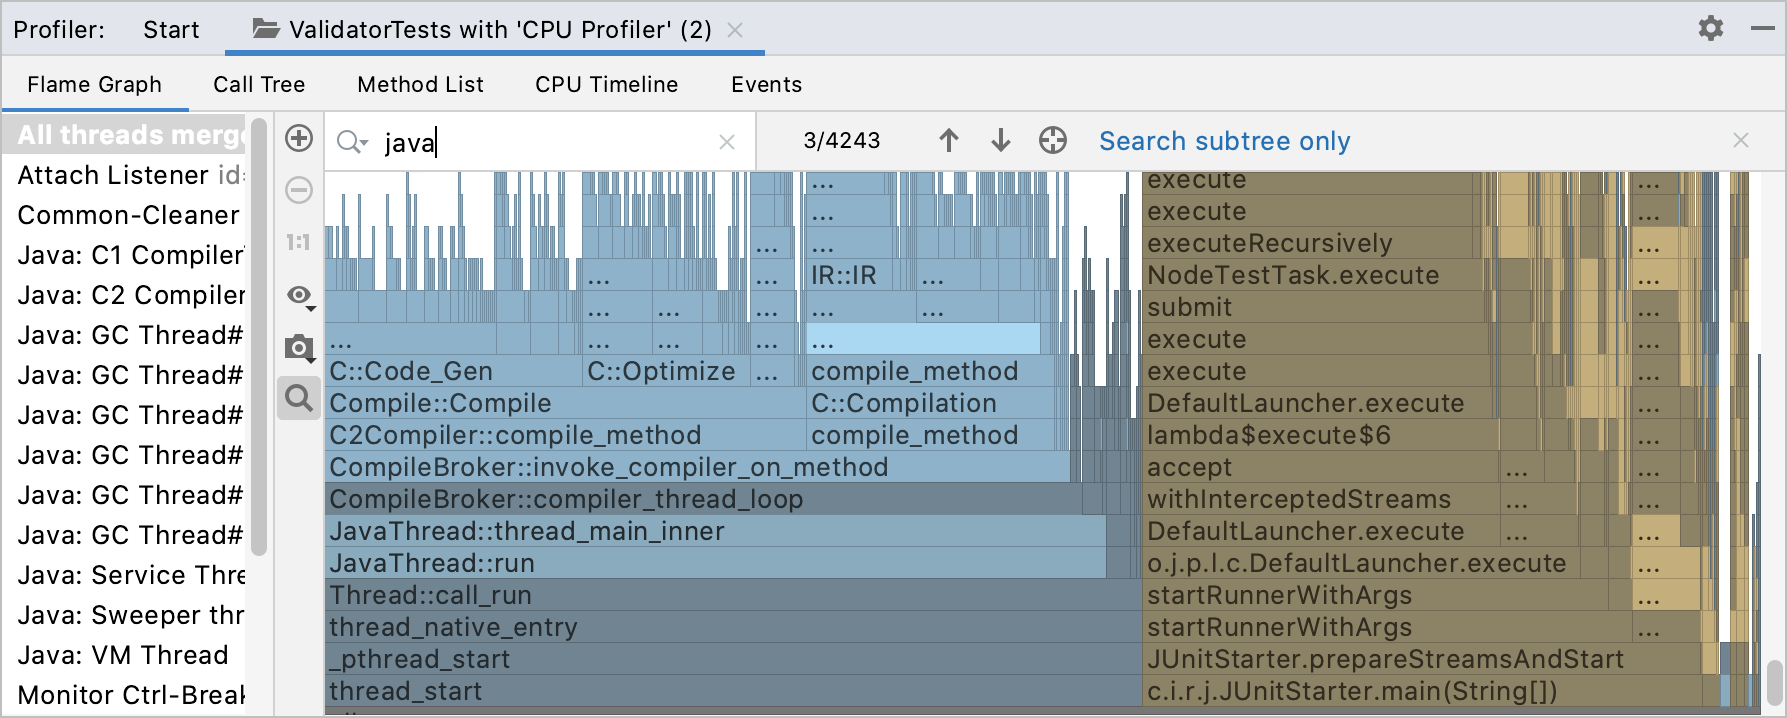
If you want to locate a specific method on the graph, start typing its name or click
and type the name in the search bar.
The graph highlights all blocks with method names matching your search request.
Use
and
for fast navigation between search results. You can also search either in the whole graph or just in a specific subtree.
Capture the graph
You can capture and export the graph separately from other data in the report.
Click
and select Copy to Clipboard or click Save to export the graph as an image in the .png format.
tip
For more information about flame graphs, see Flame Graphs.
You can visualize the difference between two snapshots on the flame graph.
Compare with a baseline
Open two snapshots. To open snapshots, you can run the profiler twice or go to Run | Open Profiler Snapshot and select snapshots here.
Click the Compare With Baseline button and select the snapshot that you want to compare against.
A separate diff tab will open with the results of the comparison, combining two flame graphs and showing the differences as red and green.
If you see that some part of the frame is green, it means that the corresponding method became faster during this profiler run. The red color means that the corresponding method became slower.
Call Tree
The Call Tree tab represents information about a program’s call stacks that were sampled during profiling. The top-level All threads merged option shows all threads merged together into a single tree. There's also a top-down call tree for each thread.
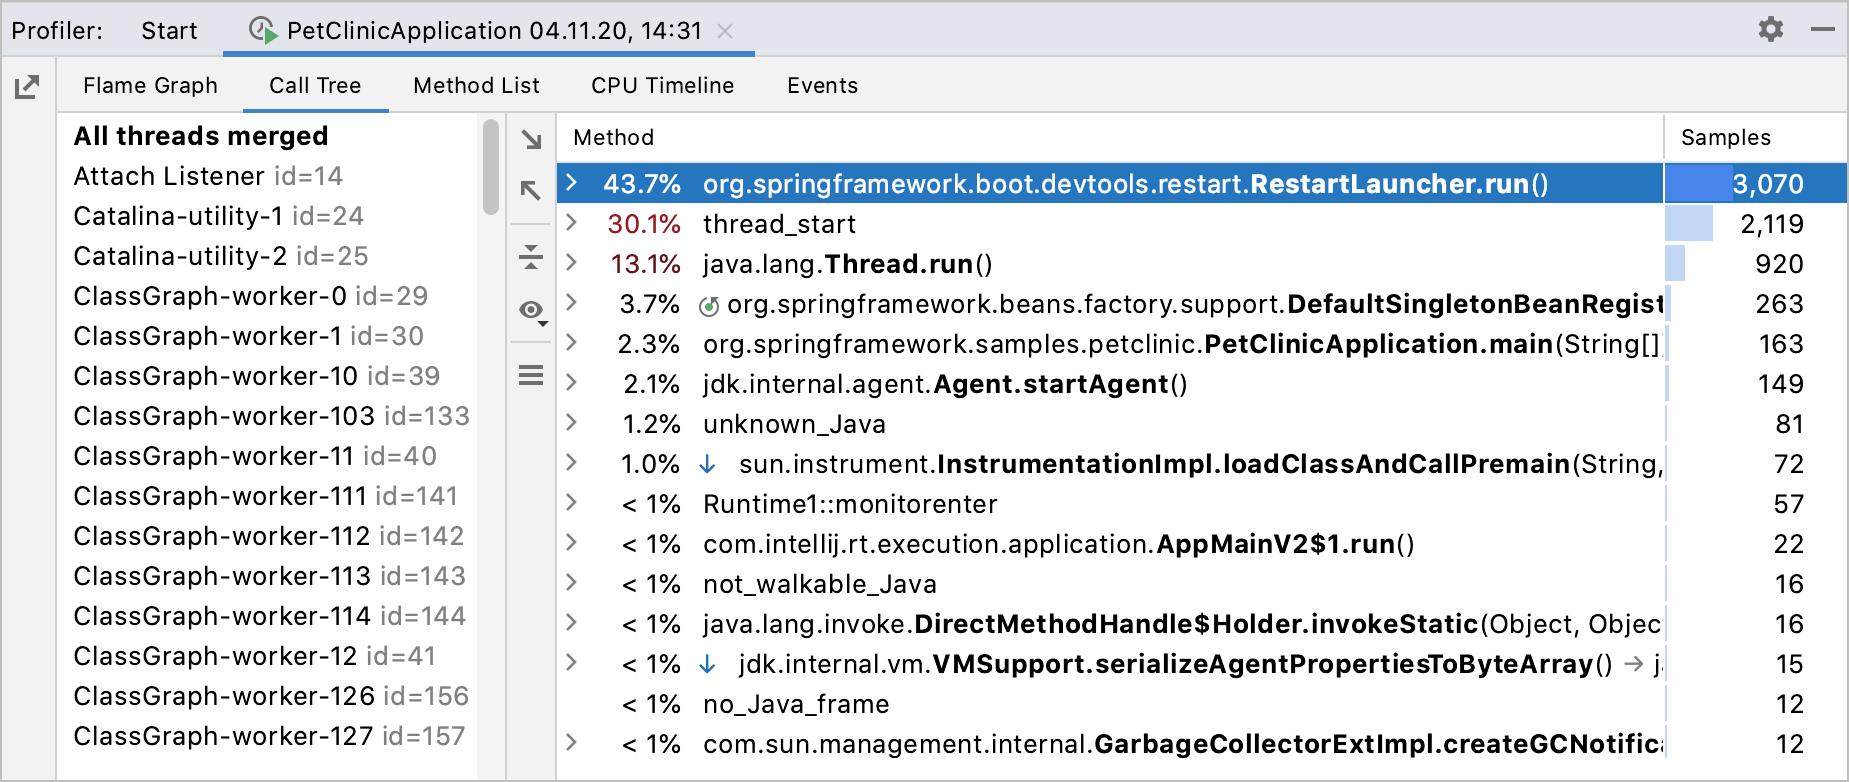
For each method, the tab shows the following information:
Names of methods
Percentage of total sample time or parent's sample time
The total sample count
tip
To toggle the percentage to the parent's call view, click
and select Show Percent of Parent.
Filter Call Tree results
The Call Tree tab allows you to collapse the frames you are not interested in at the moment by applying filters. For example, you can hide library classes or the classes that come from specific frameworks to be able to focus on the application itself.
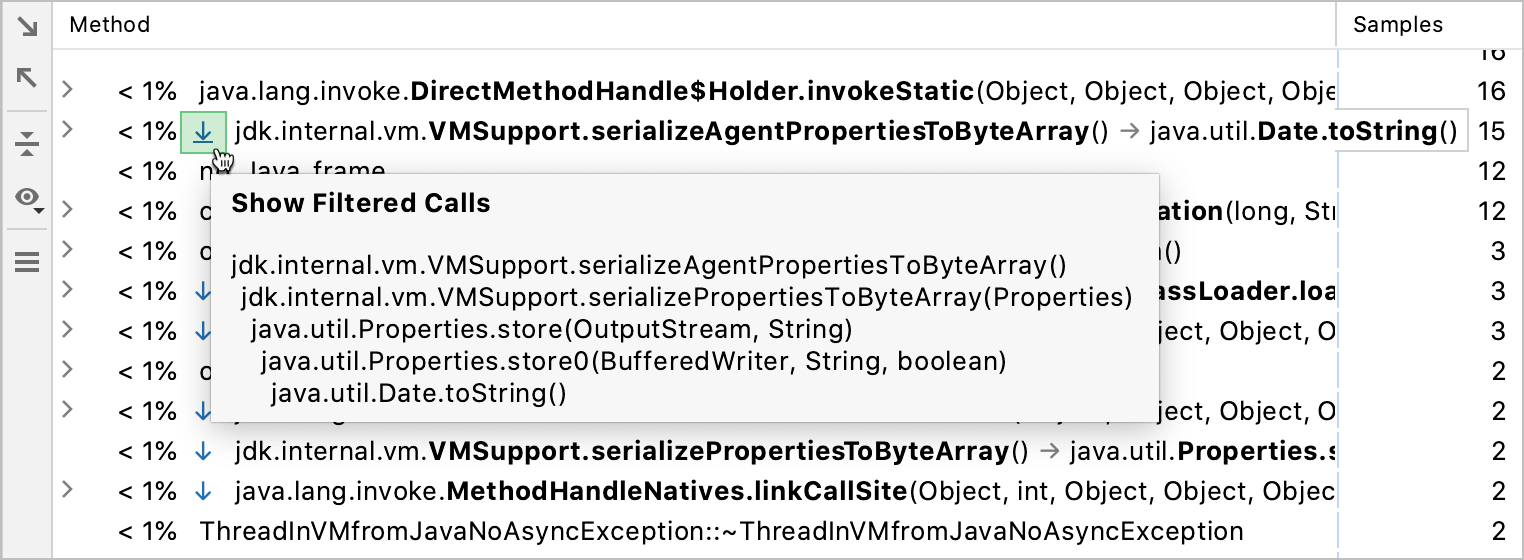
The blue arrow hyperlink right after the percentage presents a filtered sequence of calls. Click it to expand this sequence.
tip
To quickly disable filtering, click
and deselect the Filter Calls option.
In the Settings/Preferences dialog (Ctrl+Alt+S), select Build, Execution, Deployment | Java Profiler | Filters.
In this dialog, you can modify the existing rules and add new ones.
Configure the packages or specific classes that you want to be able to hide in the output.
To filter all methods in a class, specify the fully qualified class name (for example:
org.bar.ClassName).To filter specific methods in a class, use the following format: fully qualified class name : method name (for example:
* : myMethod()).

Apply the changes and close the dialog.
Collapse recursive calls
A complex application that has multiple recursive methods may be very difficult to analyze. In a regular Call Tree view, recursive calls are displayed as they are called – one after another, which in case of complex call stacks with multiple recursive calls leads to almost infinite stack scrolling.
IntelliJ IDEA detects a recursion when the same method is called higher up in the call stack. In this case, the subtree is taken out of the call tree and then attached back to the first invocation of that method. This way you can bypass recursion and focus on methods that consume most of the resources and calls that they make.
Collapsing recursive calls allows you to see the total amount of time spent in these calls as if there was no recursion.

Folded recursive calls are marked with the icon on the Call Tree tab. Click it to open the recursive call tree in a separate tab. You can preview the number of merged stacks in a tooltip.

What-if: focus on specific methods
IntelliJ IDEA allows you to examine specific methods in the Call Tree: you can exclude particular methods or other way around, focus only on the methods in which you are interested at the moment.
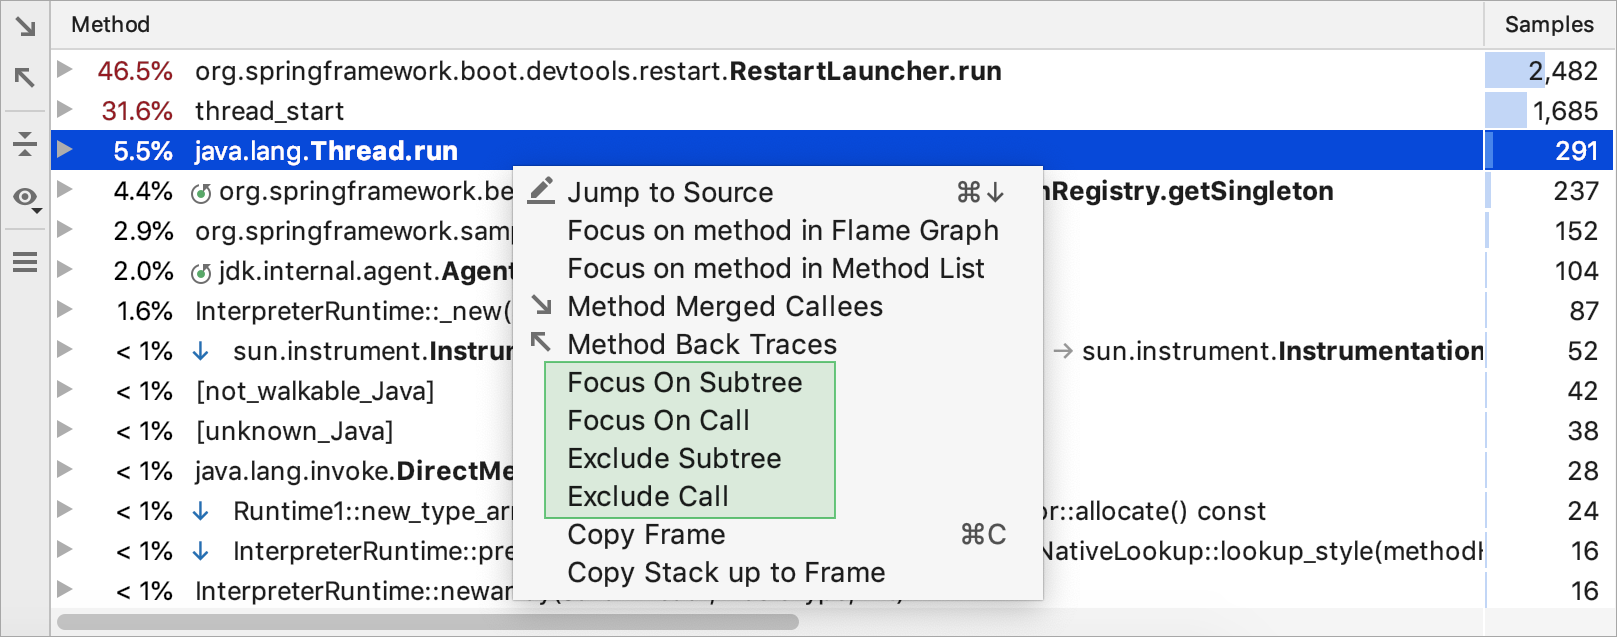
Right-click the necessary method on the Call Tree tab and select one of the following options to open the results in a dedicated tab:
Focus On Subtree: show only the selected method call. Parent method sample time counter shows only the time spent in the selected subtree.
Focus On Call: show the selected method and the methods that call it. When this option is enabled, every time frame shows only the time spent in the selected method.
Exclude Subtree: ignore the selected method call.
Exclude Call: ignore all calls to the selected method.
Method List
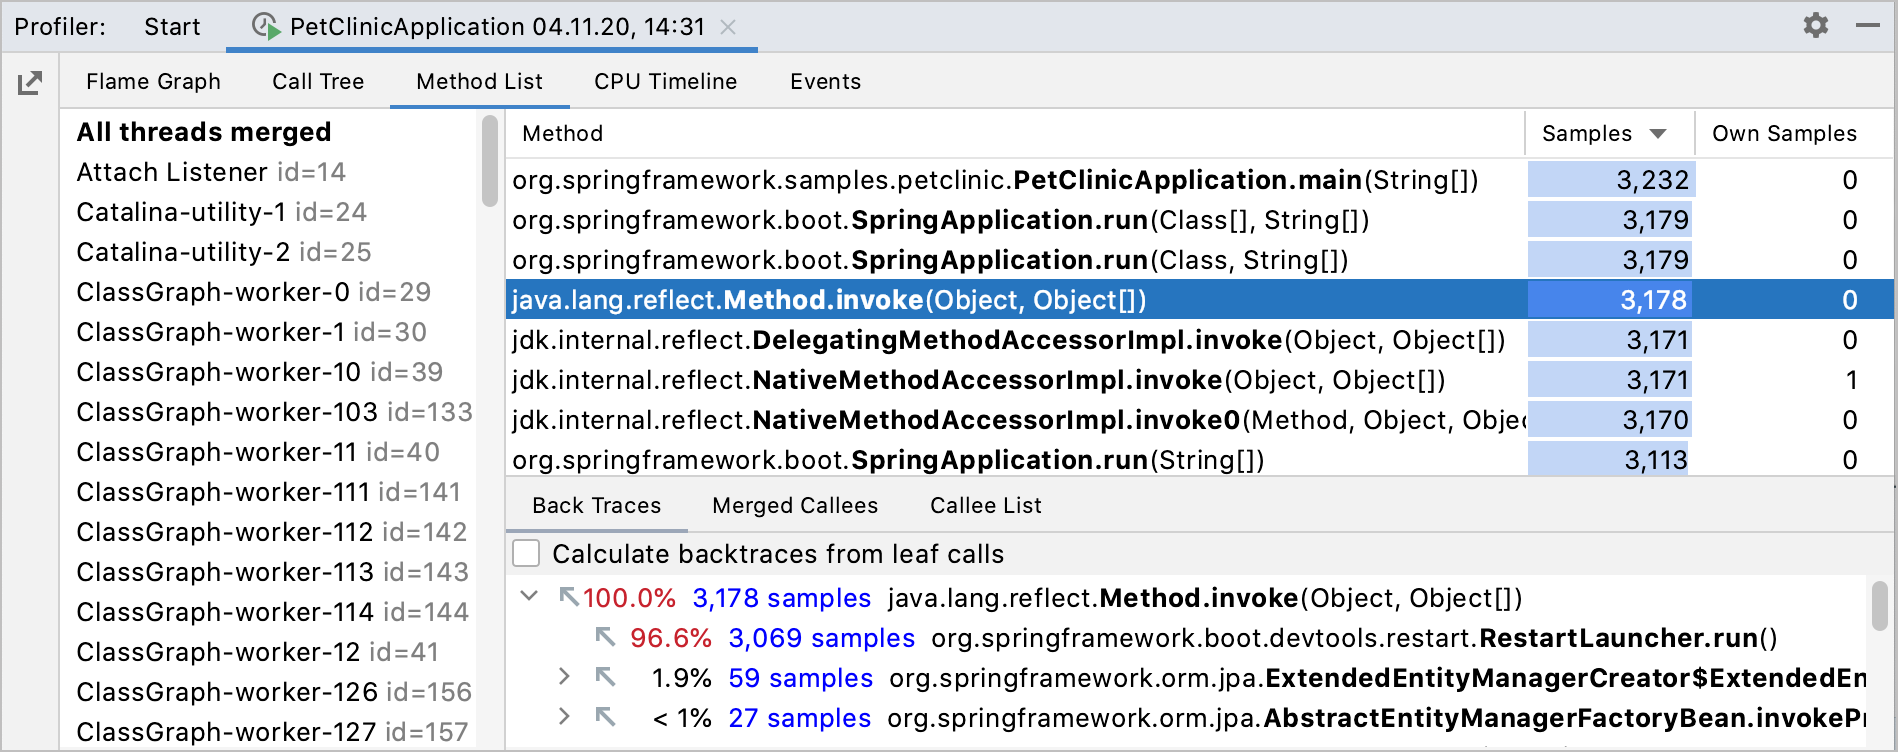
The Method List collects all methods in the profiled data and sorts them by cumulative sample time. Every item in this list has several views:
Back Traces shows the hierarchy of callers. Use this view to trace which methods call the selected method.
Merge Callees tries to summarize all methods that are called by the selected one.
Callees List shows all methods that were called from the selected one.
Timeline
The timeline helps you get full control over multi-threaded applications. It visualizes CPU consumption and memory allocation over time, which facilitates identifying critical spots and incorrect behavior.
The toolbar on the left allows you to zoom in and zoom out
the timeline.
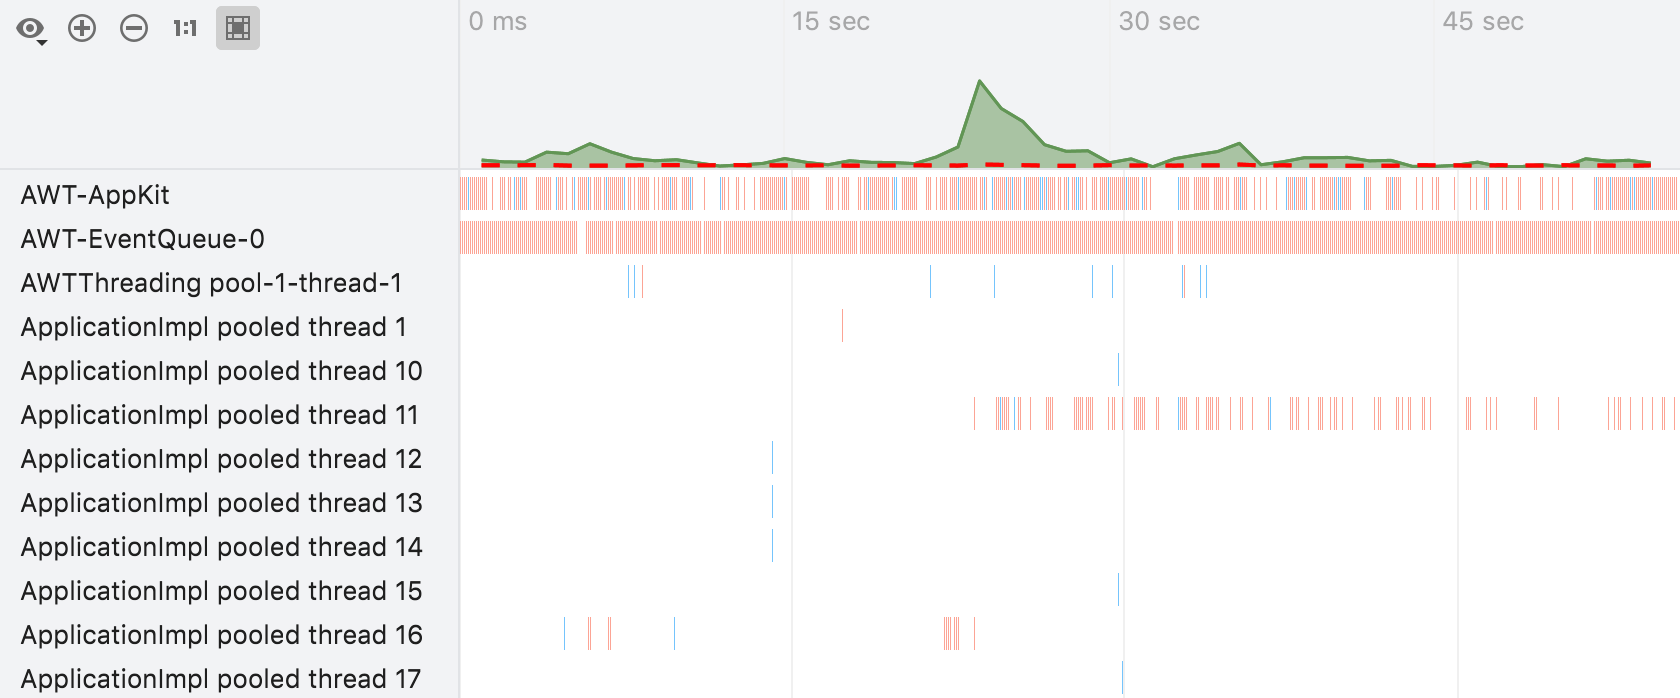
Red vertical bars indicate CPU samples
Blue vertical bars indicate memory allocation
The chart at the top shows JVM load (green) and system CPU load (red dashed line)
To filter the types of events visible on the timeline, use the Filter menu in the top-right corner of the tool window.
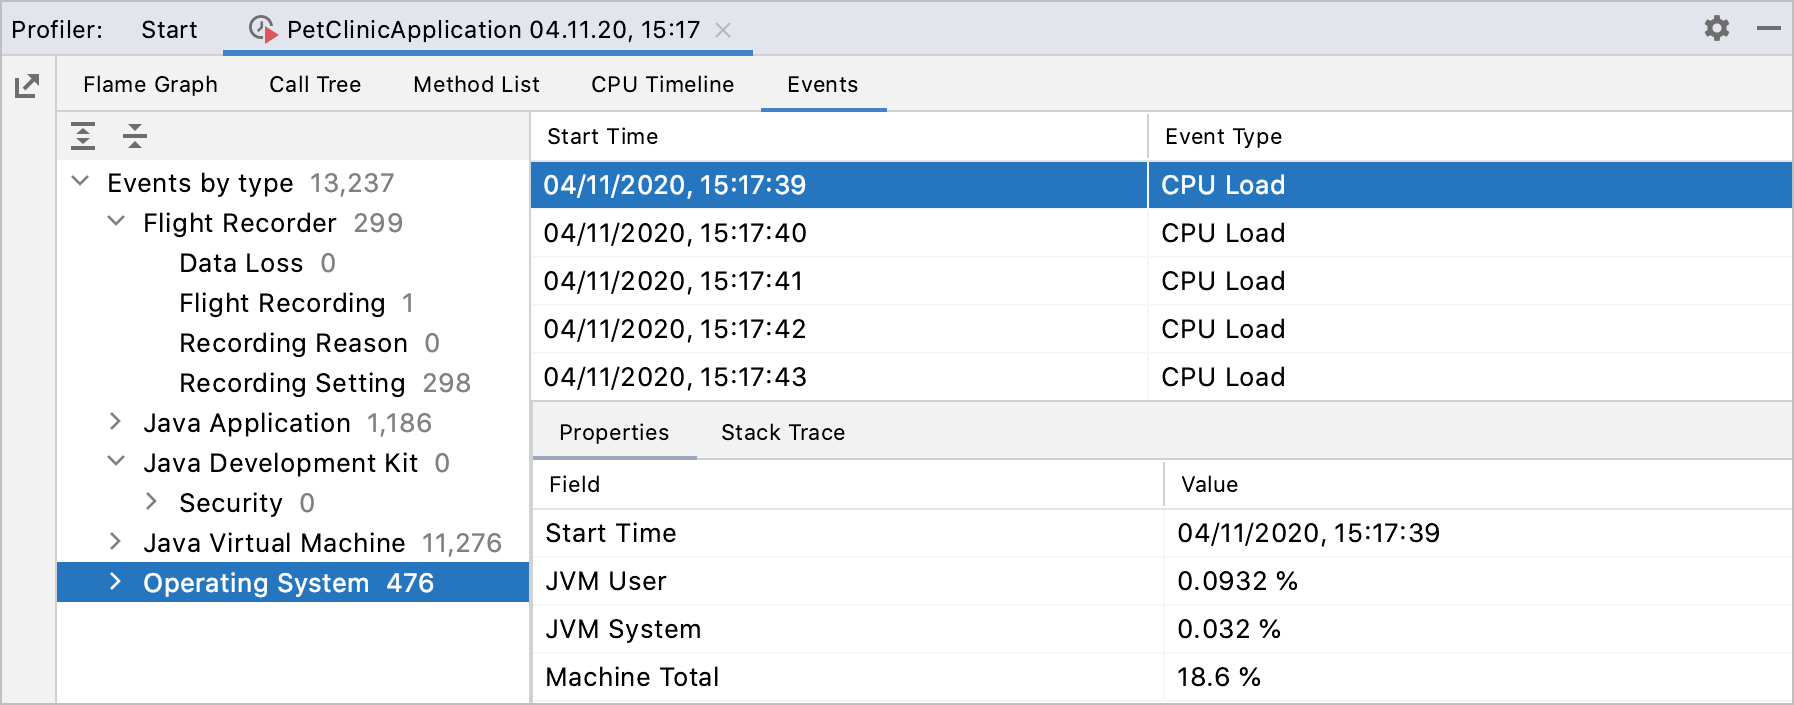
Java Flight Recorder Events
Java Flight Recorder collects data about events. Events occur in the JVM at a specific point in time. Each has a name, a timestamp, and an optional payload.
