Database diagramsUltimate
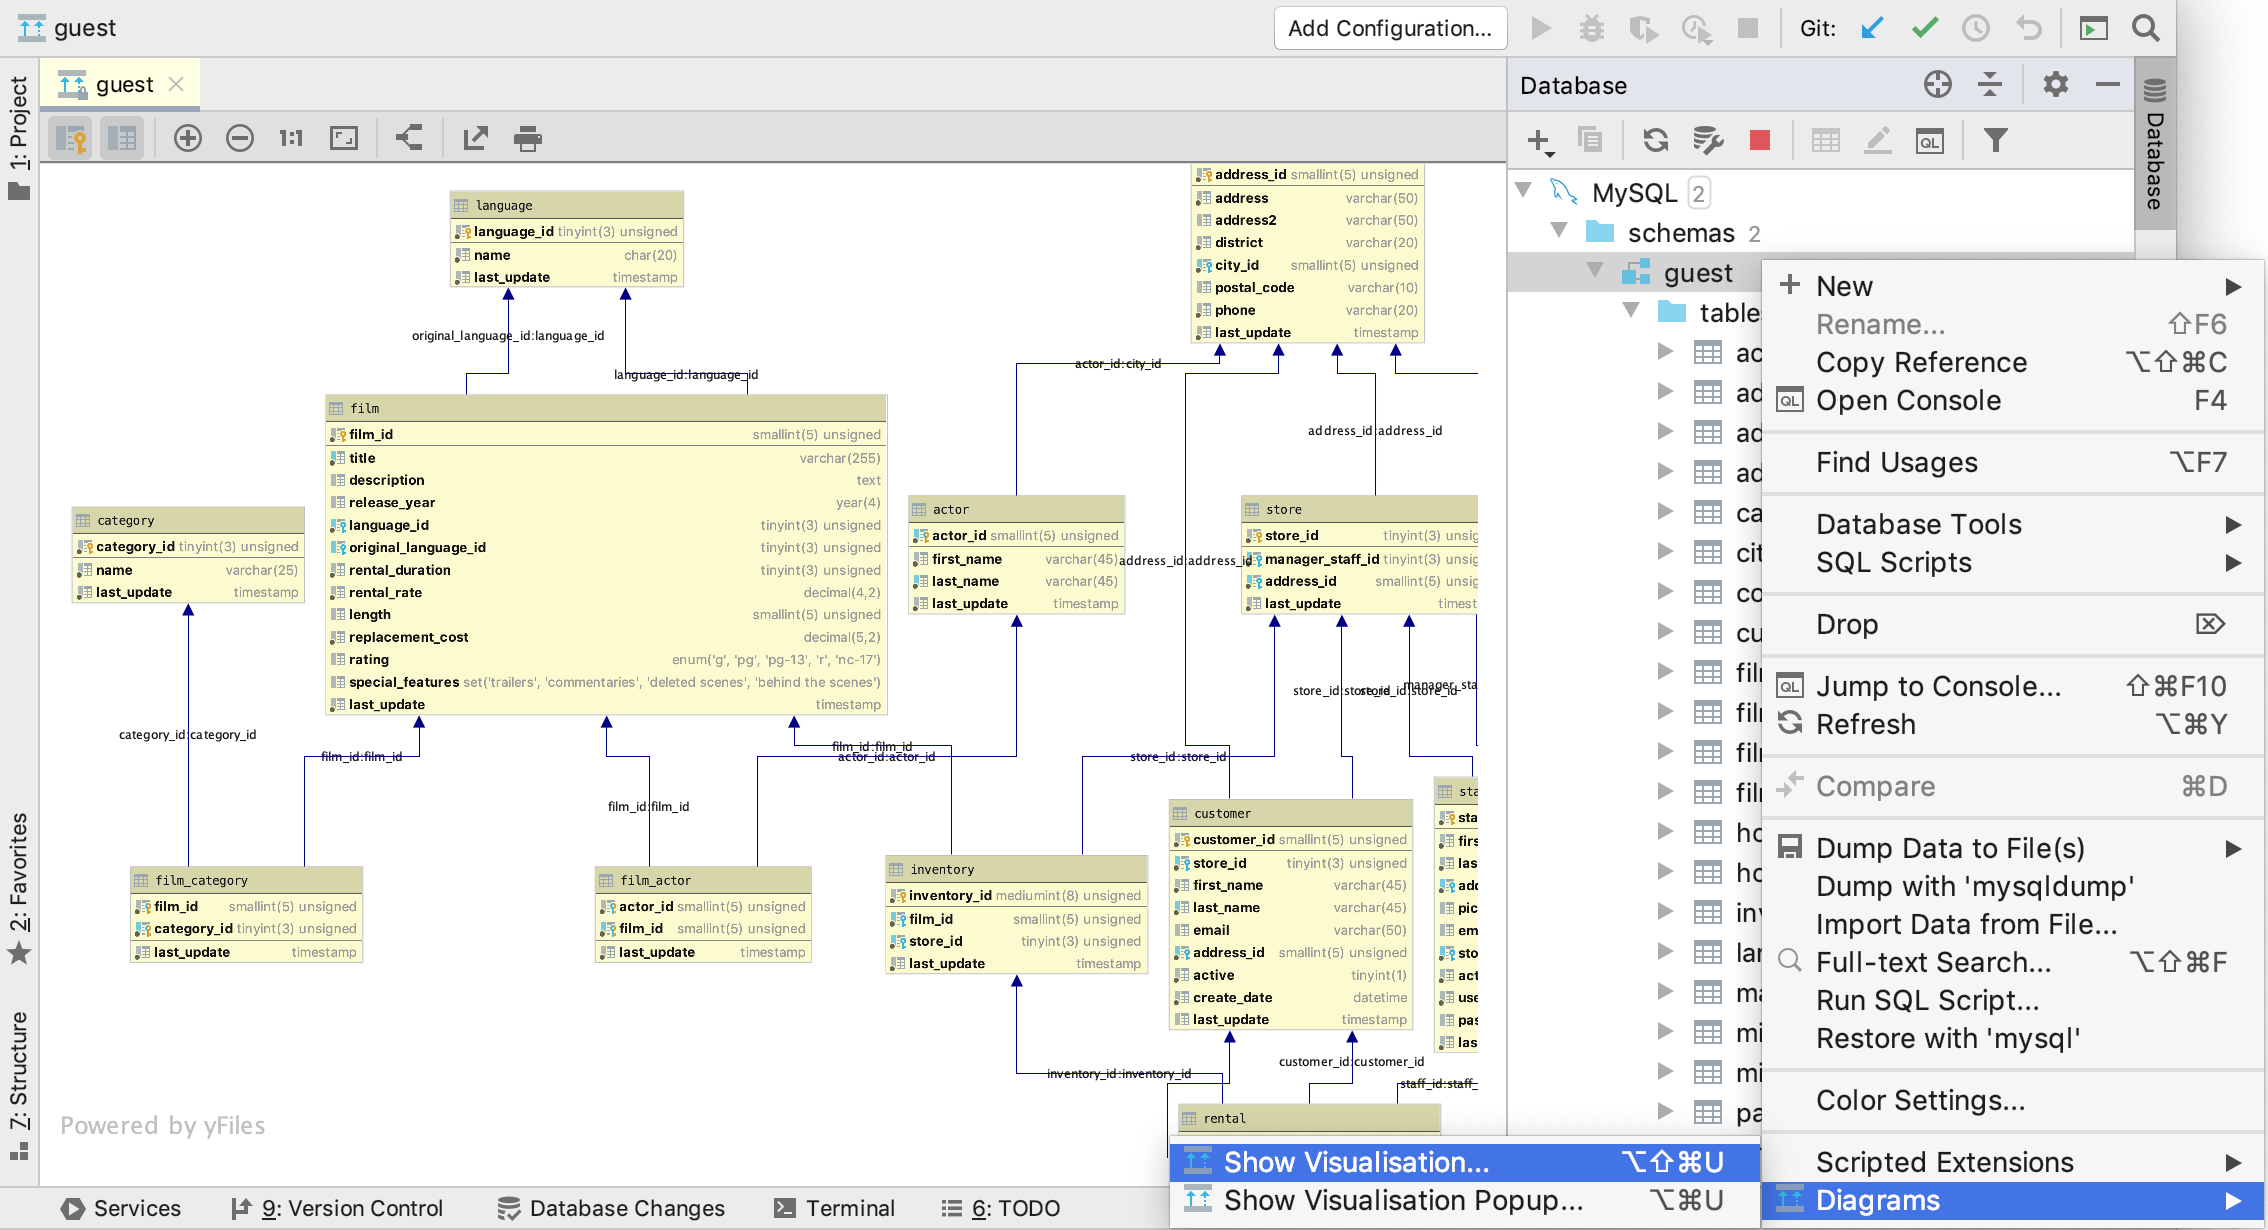
Database diagrams graphically show the structure of the database and relations between database objects. You can generate a diagram for a data source, a schema, or a table. To create relations between database objects, consider using primary and foreign keys.
You can save the generated diagrams in two formats: UML and PNG. The UML format is an internal format developed specifically for IntelliJ IDEA. It is not supported by other products. If you want to share the created diagram, consider using PNG.
Also, you can build execution plans. Execution plan is a set of steps that were used to access data in a database. IntelliJ IDEA supports two types of execution plans:
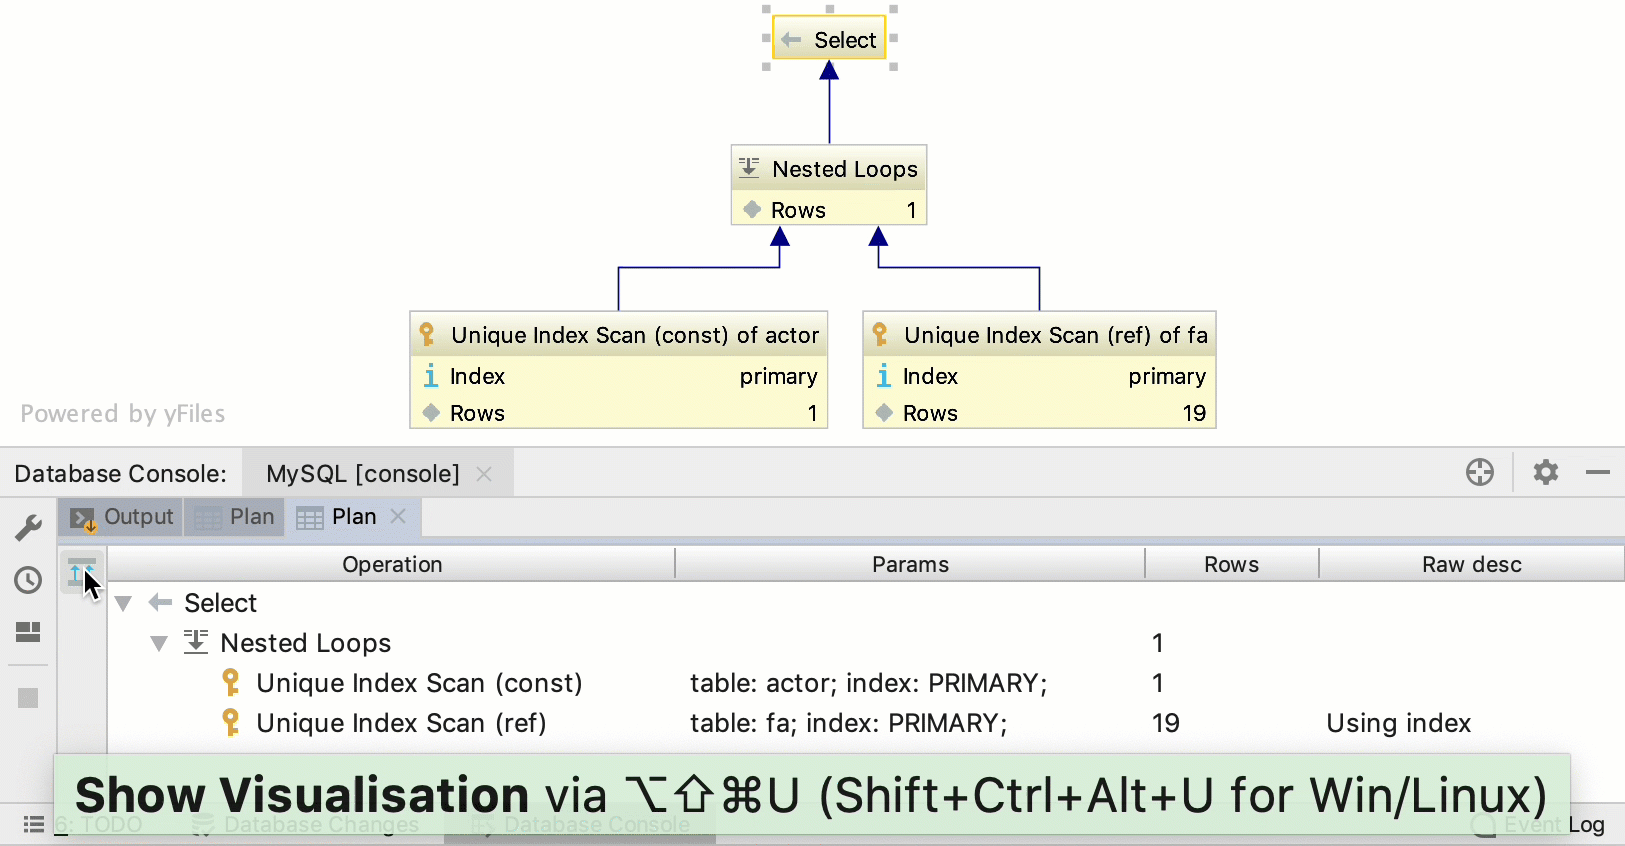
Explain Plan: the result is shown in a mixed tree and table format on a dedicated Plan tab. You can click the Show Visualization icon (
) to create a diagram that visualizes the query execution.
Explain Plan (Raw): the result is shown in a table format.
Generate a diagram for a database object
In the Database tool window (View | Tool Windows | Database ), right-click a database object and select Diagrams | Show Visualization.

Show execution plans
To create an execution plan, right-click a query in the editor and select Explain Plan. If you want to create a diagram for the query, click the Show Visualization icon (
).

Enable column comments
Generate a diagram. For more information about generating a diagram, see Generate a diagram for a database object.
Click the Comments button (
).

Save diagrams in the UML format
This UML format is an internal format supported only by IntelliJ IDEA.
Right-click a diagram and select Save UML Diagram.
To open the saved diagram, drag the UML file to the editor.
Save diagrams in the PNG format
Right-click a diagram and select Export to Image File.
Creating EXPLAIN query plan
The EXPLAIN command shows the execution plan of a statement. It means you can see details on the approach that the planner took to execute the statement. For example, how the tables are scanned, what join algorithms are used to bring together the required rows, statement execution costs, and other information.
Execution cost is the planner's guess at how long it takes to run the statement. The measurement is made in relative cost units. The execution cost has two options: start-up and total. The start-up cost shows how long it takes before the first row can be processed, while the total cost shows how long it takes to process all the rows.
If you use the ANALYZE option with EXPLAIN, the statement is actually executed, not only planned. In this case, you can see the run time statistics in milliseconds.
Generate a flame graph for EXPLAIN
Right-click an SQL statement, and select Explain Plan.
In the Output pane, click Plan.
Click the Flame Graph icon (
) and select between the following options:
Total Cost: how long it takes to return all the rows
Startup Cost: how long it takes before the first row can be processed.

Generate a flame graph for EXPLAIN ANALYSE
Right-click an SQL statement, and select Explain Analyse Plan.
In the Output pane, click Plan.
Click the Flame Graph icon (
) and select between the following options:
Total Cost: how long it takes to return all the rows (in relative cost units).
Actual Total Time: how long it takes to return all the rows (in milliseconds).
Startup Cost: how long it takes before the first row can be processed (in relative cost units).
Actual Startup Time: how long it takes before the first row can be processed (in milliseconds).
