Analyze memory snapshotsUltimate
Memory snapshots are useful for identifying performance problems. You can analyze the heap to locate the parts of the code that use large amounts of memory resources, and to find memory leaks. In IntelliJ IDEA, you can capture memory snapshots of running processes and analyze them in the Profiler tool window.
Take a memory snapshot
From the main menu, select View | Tool Windows | Profiler, right-click a running process and select Capture Memory Snapshot.

The snapshot is saved to the snapshots folder and appears under Recent Snapshots in the Profiler tool window.
Open a memory snapshot
From the main menu, select View | Tool Windows | Profiler and click Open Snapshot.
Alternatively, from the main menu, select Run | Open Profiler Snapshot | Open or drag the necessary file from your system file manager to the editor.

In the dialog that opens, select the necessary memory dump file with the .hprof extension and click Open.
Take a memory snapshot of the IDE
This action takes a snapshot of the IDE itself, not the application that you develop.
From the main menu, select Help | Diagnostic Tools | Capture Memory Snapshot.
When the snapshot is captured, a notification appears at the bottom of the screen.
After that, you can open the IDE snapshot from the main menu. Memory snapshots are saved to the home directory on your computer.

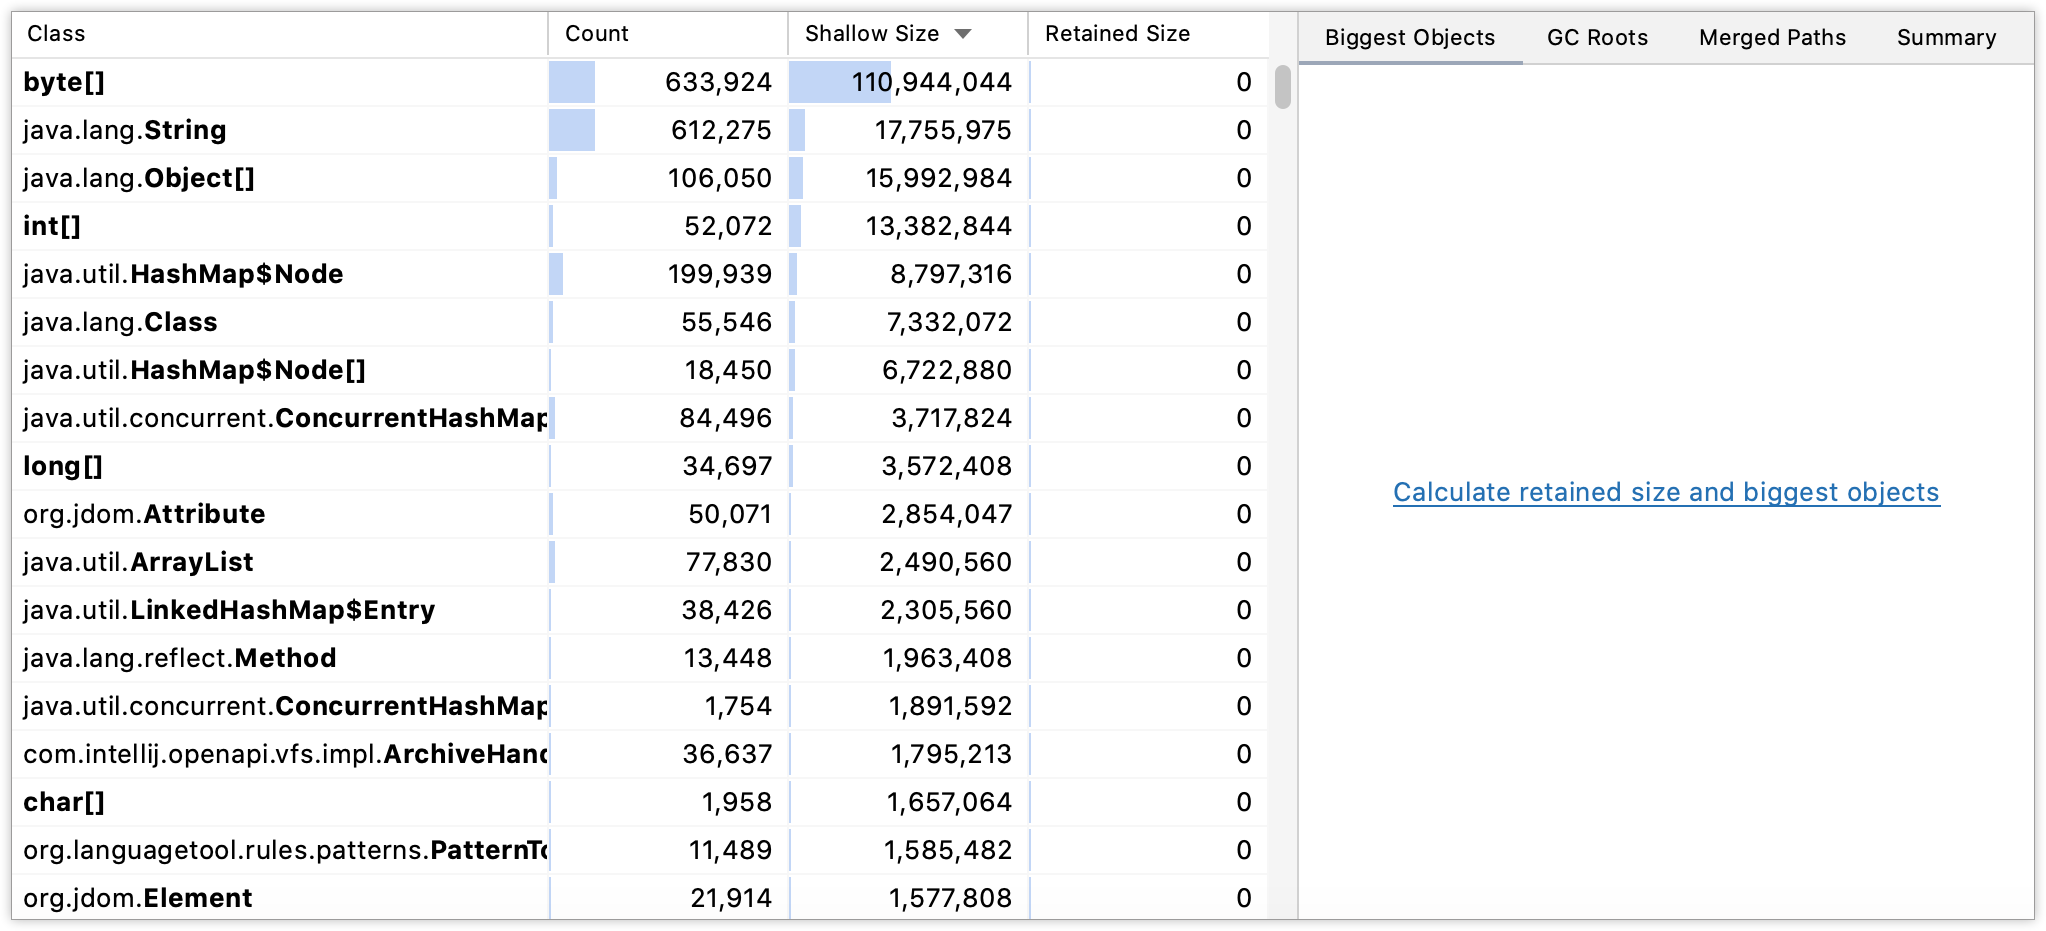
IntelliJ IDEA opens the Profiler tool window with a memory snapshot breakdown.

Read a memory snapshot file
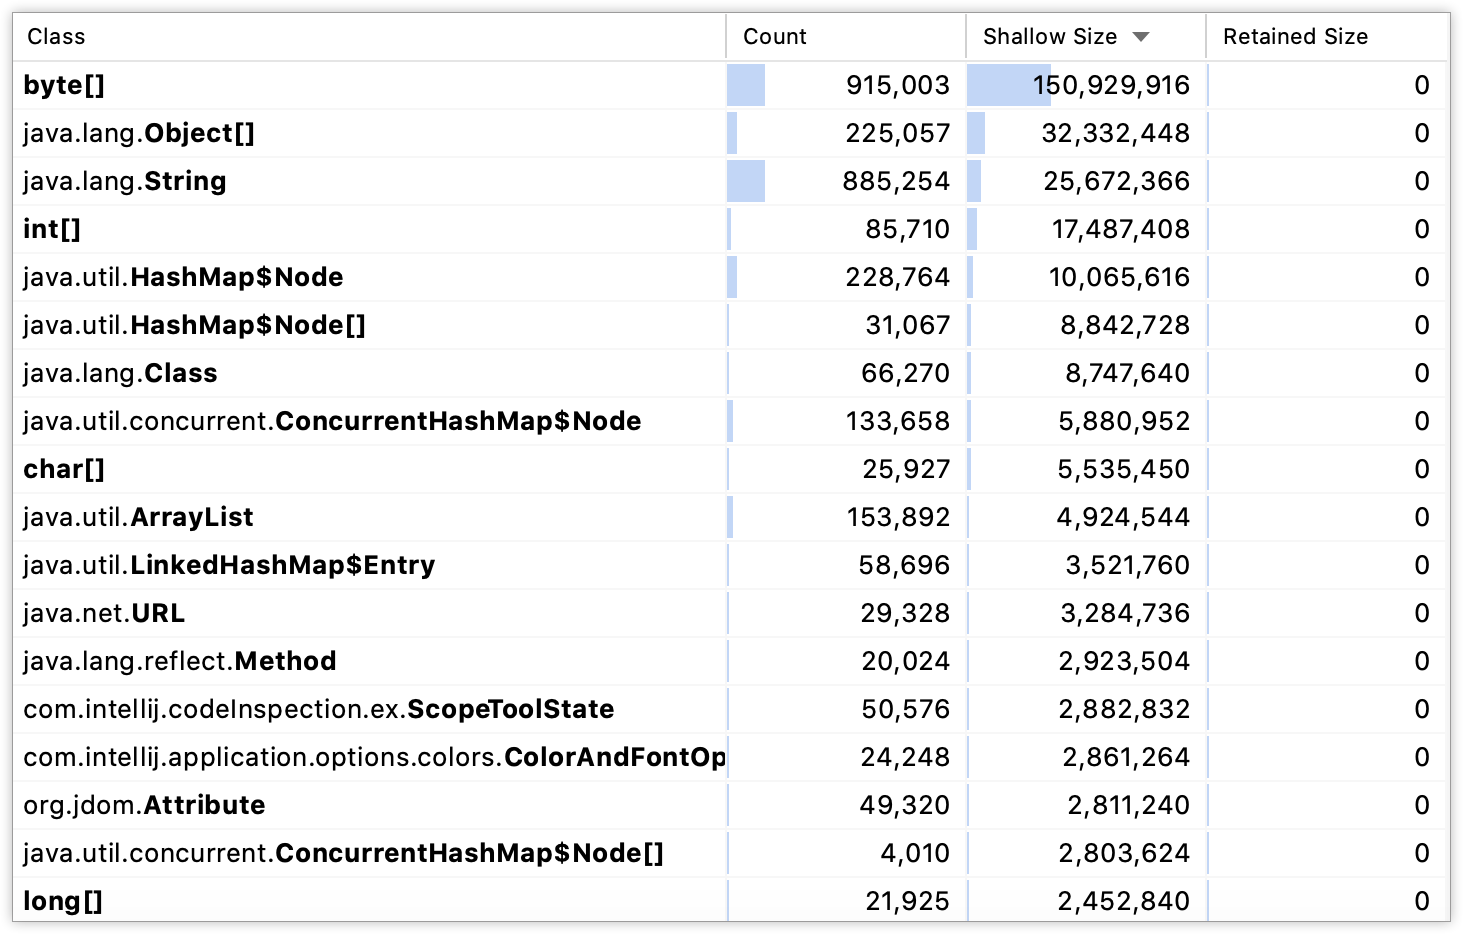
The left-hand part of the snapshot displays the list of classes in your application, how many times each class is used, its shallow size and its retained size.
Shallow size: the sum of all objects' shallow sizes, where the shallow size of an object is the amount memory allocated to store the object itself.
Retained size: the sum of the object's retained sizes. The object's retained size is the sum of the object's shallow size and the shallow size of its retained objects (objects that can be accessed only from this object).

The right-hand part of the snapshot has several tabs that allow you to calculate and display the following information:
The Biggest Objects tab lists objects that retain most of the memory ordered by their retained size. These objects are presented as dominator tree roots. This tab can help you find memory leaks caused by individual objects.

The GC Roots tab shows garbage collector root objects grouped by classes. This information is an overview of all objects that could not be garbage collected the moment the snapshot was taken.

The Merged Paths tab shows dominator objects that are grouped by class. For every class name, you can see the number of objects in it. This information helps understand how classes are retained.

The Summary tab shows general information, for example, the total size, number of instances and stack traces of the file.

Object view
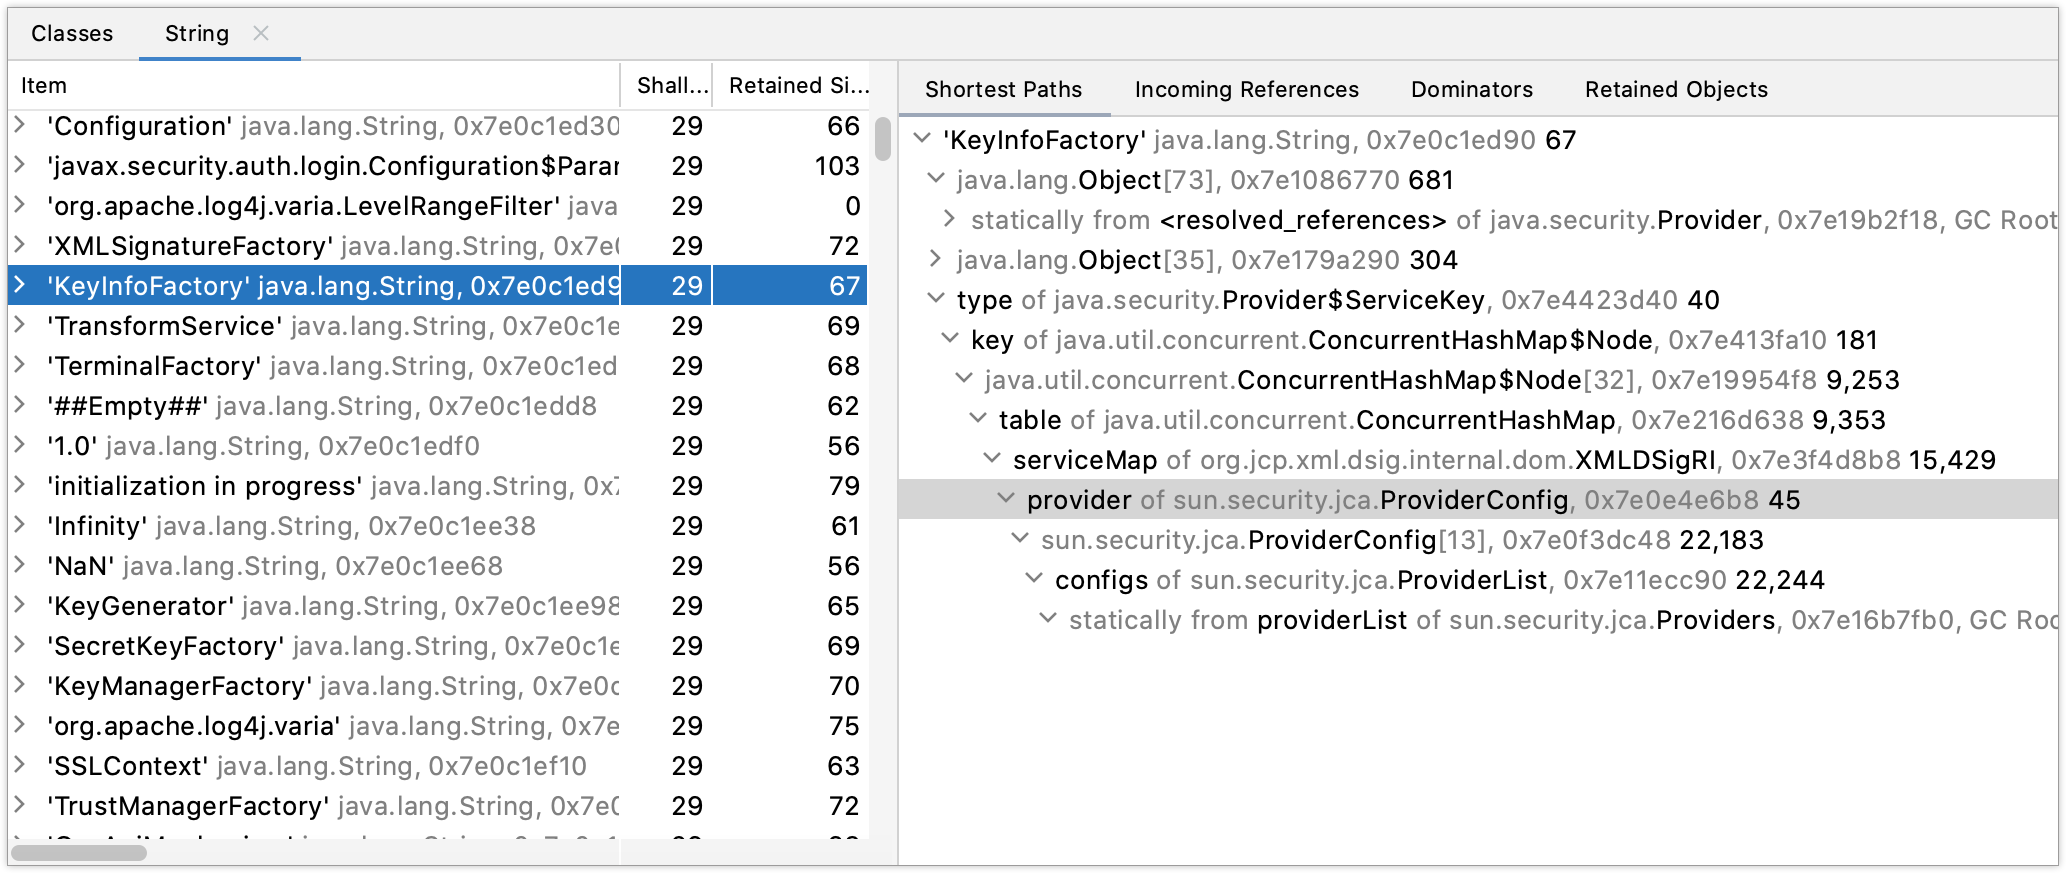
The Object view displays class instances ordered by their retained size.
You can open the view by double-clicking an item on the Classes tab. You can also right-click an item and select Open in New Tab or press Enter.

For each class instance, there are several tabs that allow you to calculate and display the following information:
Shortest Paths: the shortest reference chains to garbage collector roots for the instances that haven't been garbage collected.
Incoming References: incoming references from other instances.
Dominators: allows you to see the instances that prevents the previous instances from being garbage collected. Every instance has only one dominator or hasn't got any.
Retained Objects: shows objects in a way that the next level shows those objects that are immediately prevented from being garbage collected.
Productivity tips
- Use speed search
On the Classes tab and in the Object view, you can use speed search.
Start typing a class name. As you type, the Search for field appears over the tool window showing the entered characters, and the selection moves to the first item that matches the specified name. For more information, refer to Speed search in tool windows.
- Navigate to source
You can quickly navigate from the Profiler tool window to the corresponding line in the source code: right-click an item and select Jump to Source or press F4.