Database diagrams
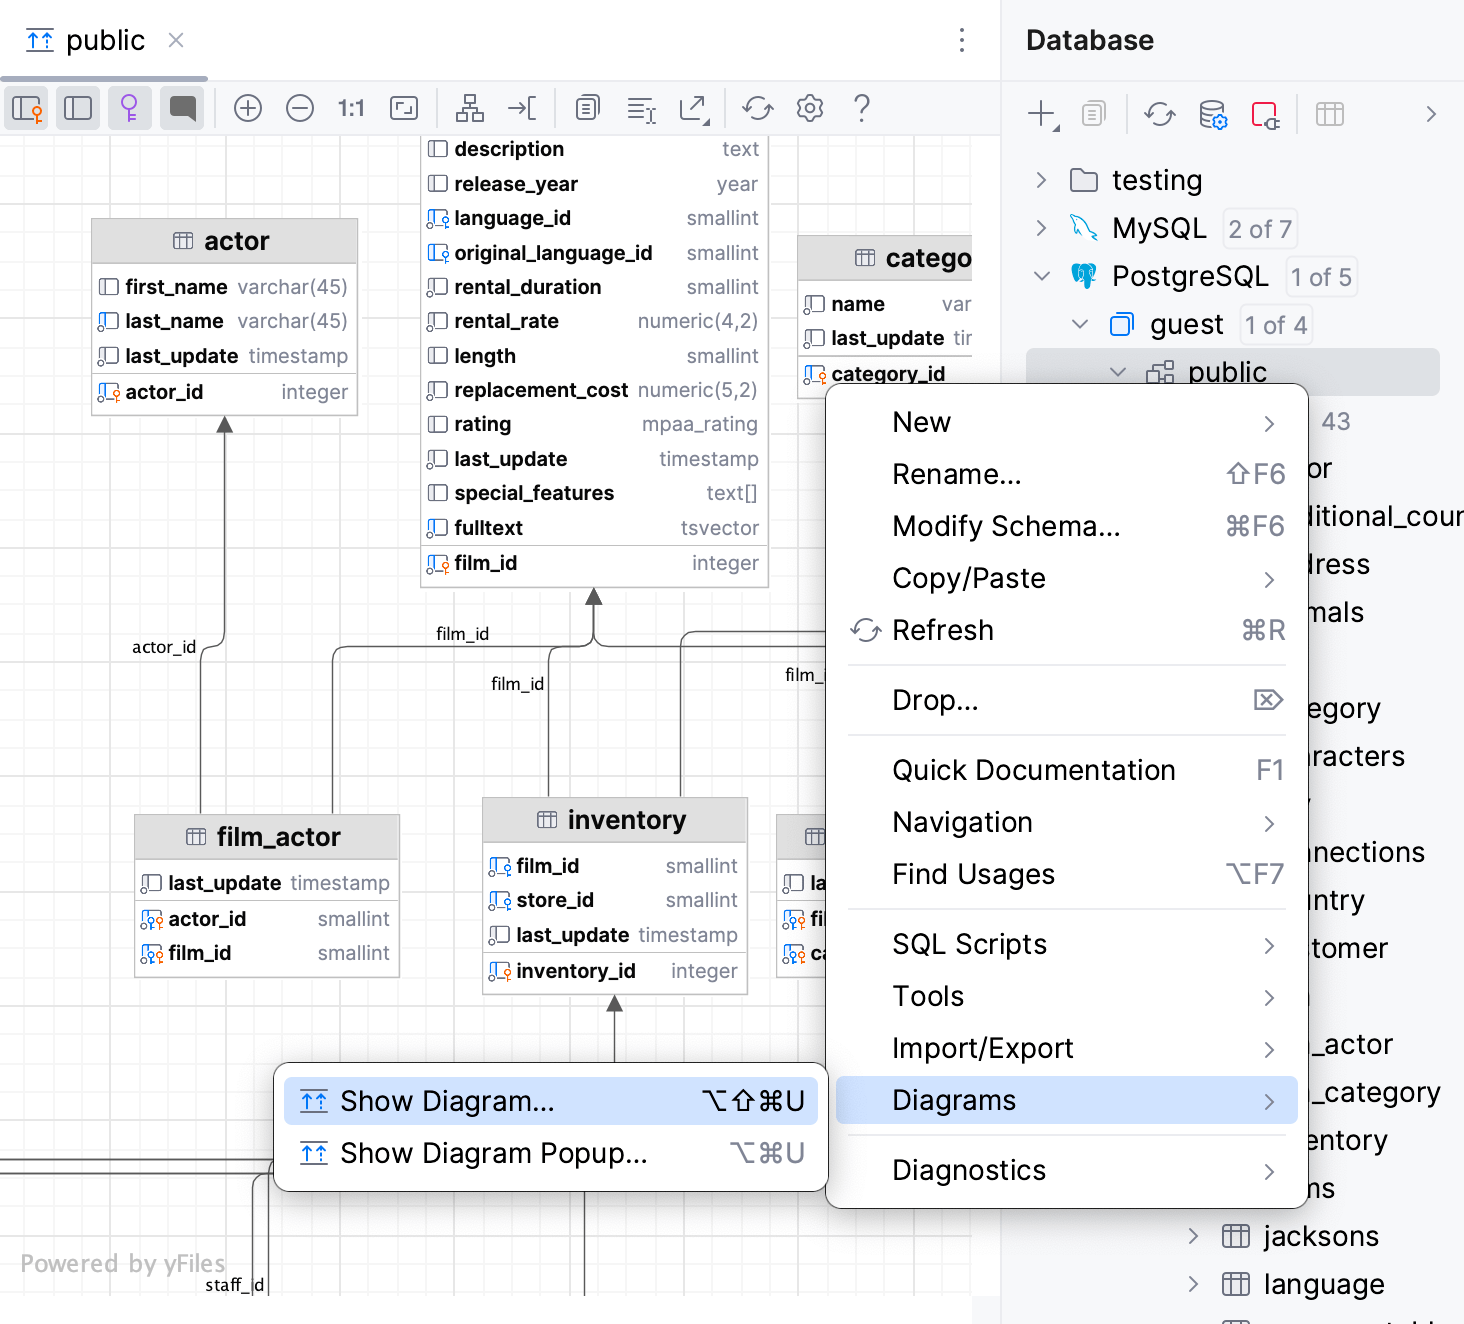
Database diagrams graphically show the structure of the database and relations between database objects. You can generate a diagram for a data source, a schema, or a table. To create relations between database objects, consider using primary and foreign keys.
You can save the generated diagrams in two formats: UML and PNG. The UML format is an internal format developed specifically for GoLand. It is not supported by other products. If you want to share the created diagram, consider using PNG.
Also, you can build execution plans. An execution plan is a set of steps that were used to access data in a database. For more information about creating an execution plan, refer to Visualize a query plan.
In the Database tool window ( View | Tool Windows | Database) , right-click a database object and select Diagrams | Show Diagram.

To pan and zoom the diagram, use your touchpad, scroll bars or the mouse wheel for vertical scrolling and Shift + mouse wheel for horizontal scrolling. You can also use Shift + mouse wheel for zooming.
To use the magnifier tool, keep the Alt key pressed, and hover your mouse pointer over the desired areas of the diagram. Use the mouse wheel to extra zoom the diagram area within magnifier tool.

Generate a diagram. For more information about generating a diagram, see Generate a diagram for a database object.
Click the Comments button (
).

In the Database tool window ( View | Tool Windows | Database) , right-click an object and select Tools | Set Color….
Select a color and click OK. Refresh the diagram to apply the color by clicking the Refresh button ().

This UML format is an internal format supported only by GoLand.
Right-click a diagram and navigate to Export Diagram | Export to File | IDEA .uml.
To open the saved diagram, drag the UML file to the editor.
Right-click a diagram and select Export Diagram | Export to Image.
Thanks for your feedback!