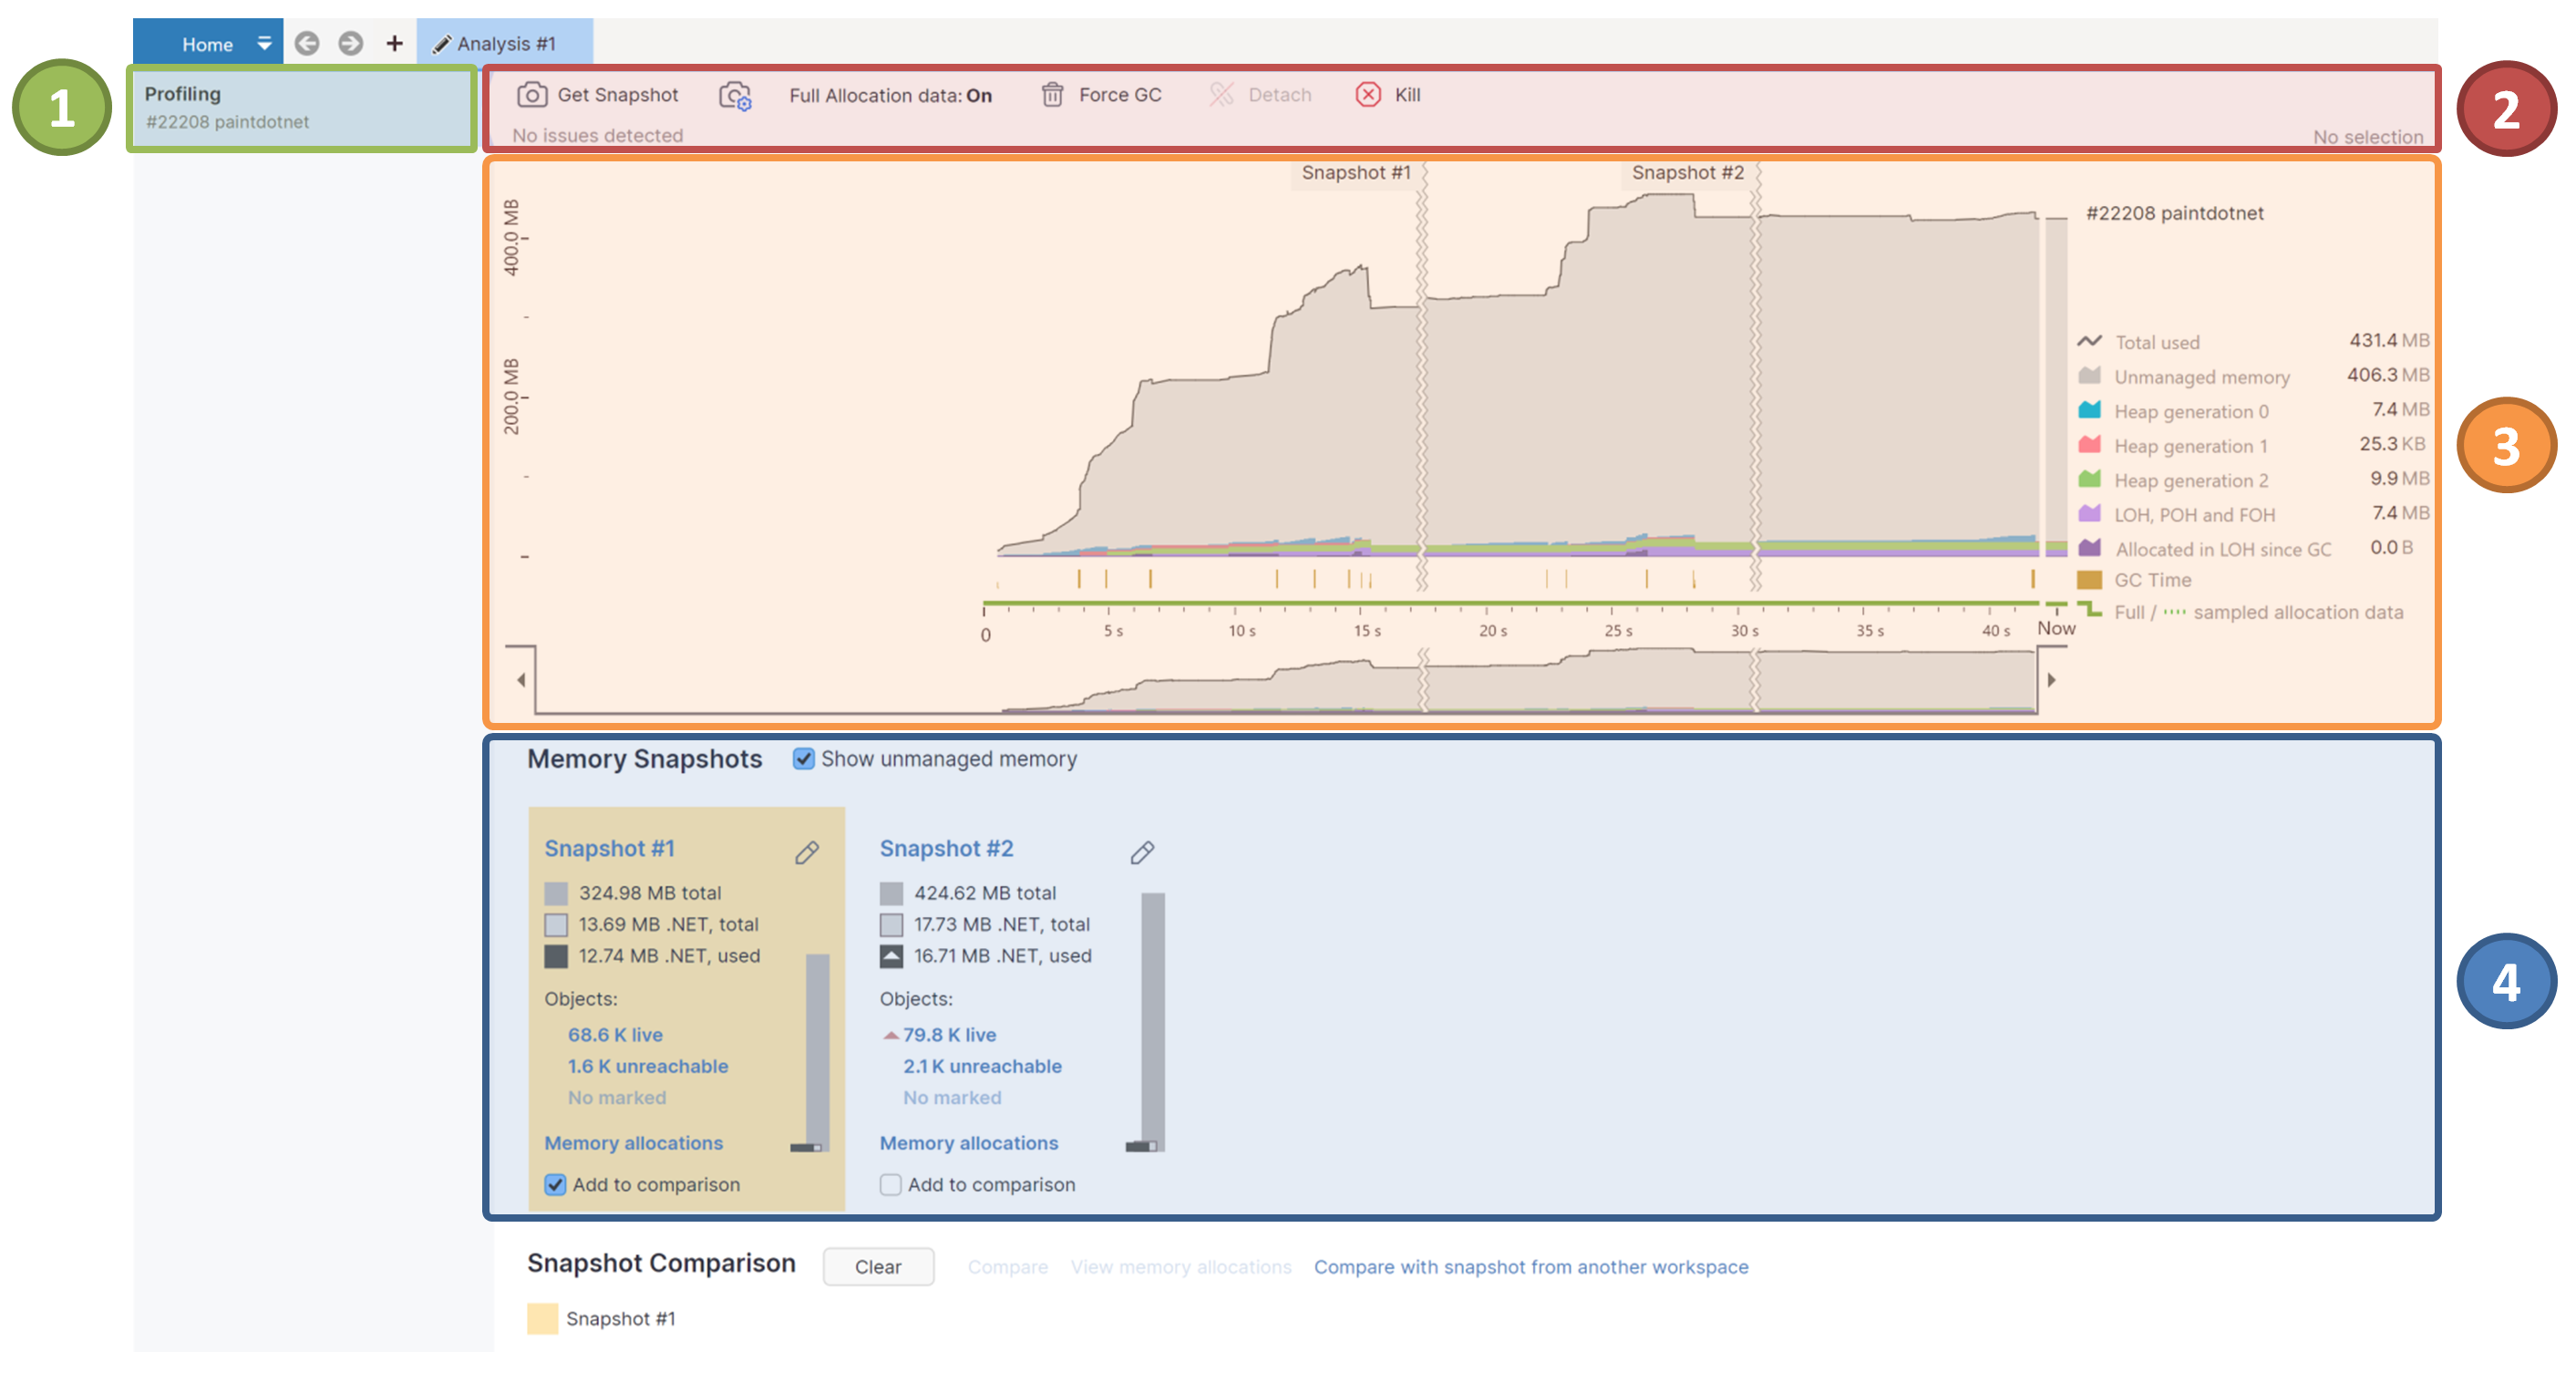
Control Profiling Session
After you run the profiling session, dotMemory will open the new Analysis tab and launch the profiled application.

To control the profiling process, use the following buttons on the top of the page ![]() :
:
| Gets a memory snapshot for the process selected in the list of processes Getting a snapshot doesn't interrupt the profiling process, allowing you to get another snapshot (which, for example, can be compared with the first one later). After you finish capturing snapshots, you can proceed to analyzing profiling results. |
| Opens the Get Snapshot on Condition window. Using this window, you can configure dotMemory to automatically get snapshots when a particular condition is triggered. Learn more |
Full allocation data | Off (default): the profiler collects sampled data on memory allocation calls with approximate size of allocated objects. This mode doesn't affect application performance. Time intervals with sampled data are marked with a dotted green line On: the profiler collects detailed data on calls that allocate memory, including the exact size and number of allocated objects. This mode significantly slows down the profiled application. Time intervals with full data are marked with a green line |
| Forces full garbage collection in the application. |
Detach | Detaches the profiler from the application but keeps the application running. The Detach operation is available only in case you attach the profiler to an already running app. |
| Kills the currently selected process of the application. Use Kill with caution: the unconditional termination of a process may lead to loss of data your app works with. Typically, you should close profiled apps normally. |
| Kills all processes of the application. The list of processes and the Kill All button are shown only in case you profile the app running multiple processes. |
If your standalone or .NET Core application runs more than one process, you can take a memory snapshot of a particular process.
Start profiling with a process filter that allows profiling of the entire process tree. For example, you can select the predefined Entire process tree filter.
After the profiling session starts, select the desired process from the list
 .
.Click Get Snapshot.
The timeline graph ![]() serves two main purposes:
serves two main purposes:
It shows how your app consumes memory in real time. The timeline consists of a number of charts showing:
Unmanaged memory: an instant size of unmanaged memory. To add this chart, select the Show unmanaged memory checkbox in
 .
.Heap generation 0, 1, 2, Large Object Heap (LOH): instant sizes of Gen0, Gen1, Gen2 heaps and Large Object Heap.
Allocated in LOH since GC: an instant size of objects allocated to Large Object Heap since the last Garbage Collection (after each GC, the chart restarts from zero). Use this chart to understand when LOH allocations happen (on application startup, during some work, and so on) and how intense they're (for example, the app can have some significant LOH memory traffic that doesn't change the LOH size).
It lets you select a time interval to analyze memory allocation.
Sometimes you may be interested in taking snapshots only when a certain condition takes place. The most popular case is taking a snapshot when the memory consumption of your application is dramatically increased. As doing this manually (using the Get Snapshot button) is quite tricky, dotMemory allows you to automate this process. All you need is to set a particular condition, and snapshots will be collected automatically after the condition takes place. Currently, the following conditions are supported:
Memory consumption increase in MB.
Memory consumption increase in %.
Period of time in minutes (periodical taking of snapshots).
For a more thorough control over snapshot-taking conditions (for example, taking a snapshot at a specific execution point of your program), use the dotMemory API.
note
* Total memory (includes unmanaged memory even if the Show unmanaged memory checkbox is cleared).
After the profiling session is started, click the Get Snapshot by Condition button in profiling controls.
Select desired conditions in the Automatically get a snapshot section and specify particular values for them:
if memory consumption increases by [X] MB – automatically get a snapshot when memory consumption* exceeds the baseline by X MB. The first baseline is memory consumption at the moment when you click the Start button in the Get Snapshot by Condition window. After the condition takes place, dotMemory gets a snapshot, and the memory consumption at that moment becomes a new baseline.
if memory consumption increases by [X] % – automatically get a snapshot when memory consumption exceeds the baseline by X percent. The first baseline is memory consumption at the moment when you click the Start button in the Get Snapshot by Condition window. After the condition takes place, dotMemory gets a snapshot, and the memory consumption at that moment becomes a new baseline.
if memory consumption exceeds [X] MB – automatically get a snapshot when total memory consumption (absolute value) exceeds X MB.
every [X] minutes – automatically get a snapshot every X minutes.
Select the Limit the max number of snapshots to [X] checkbox if you want dotMemory to take no more than X snapshots. This option can be useful if you're limited on the disk space.
Click Start.
Click the Get Snapshot by Condition button in profiling controls.
Click Stop.