Profile your Application
See how your application is performing with the built-in profiler.
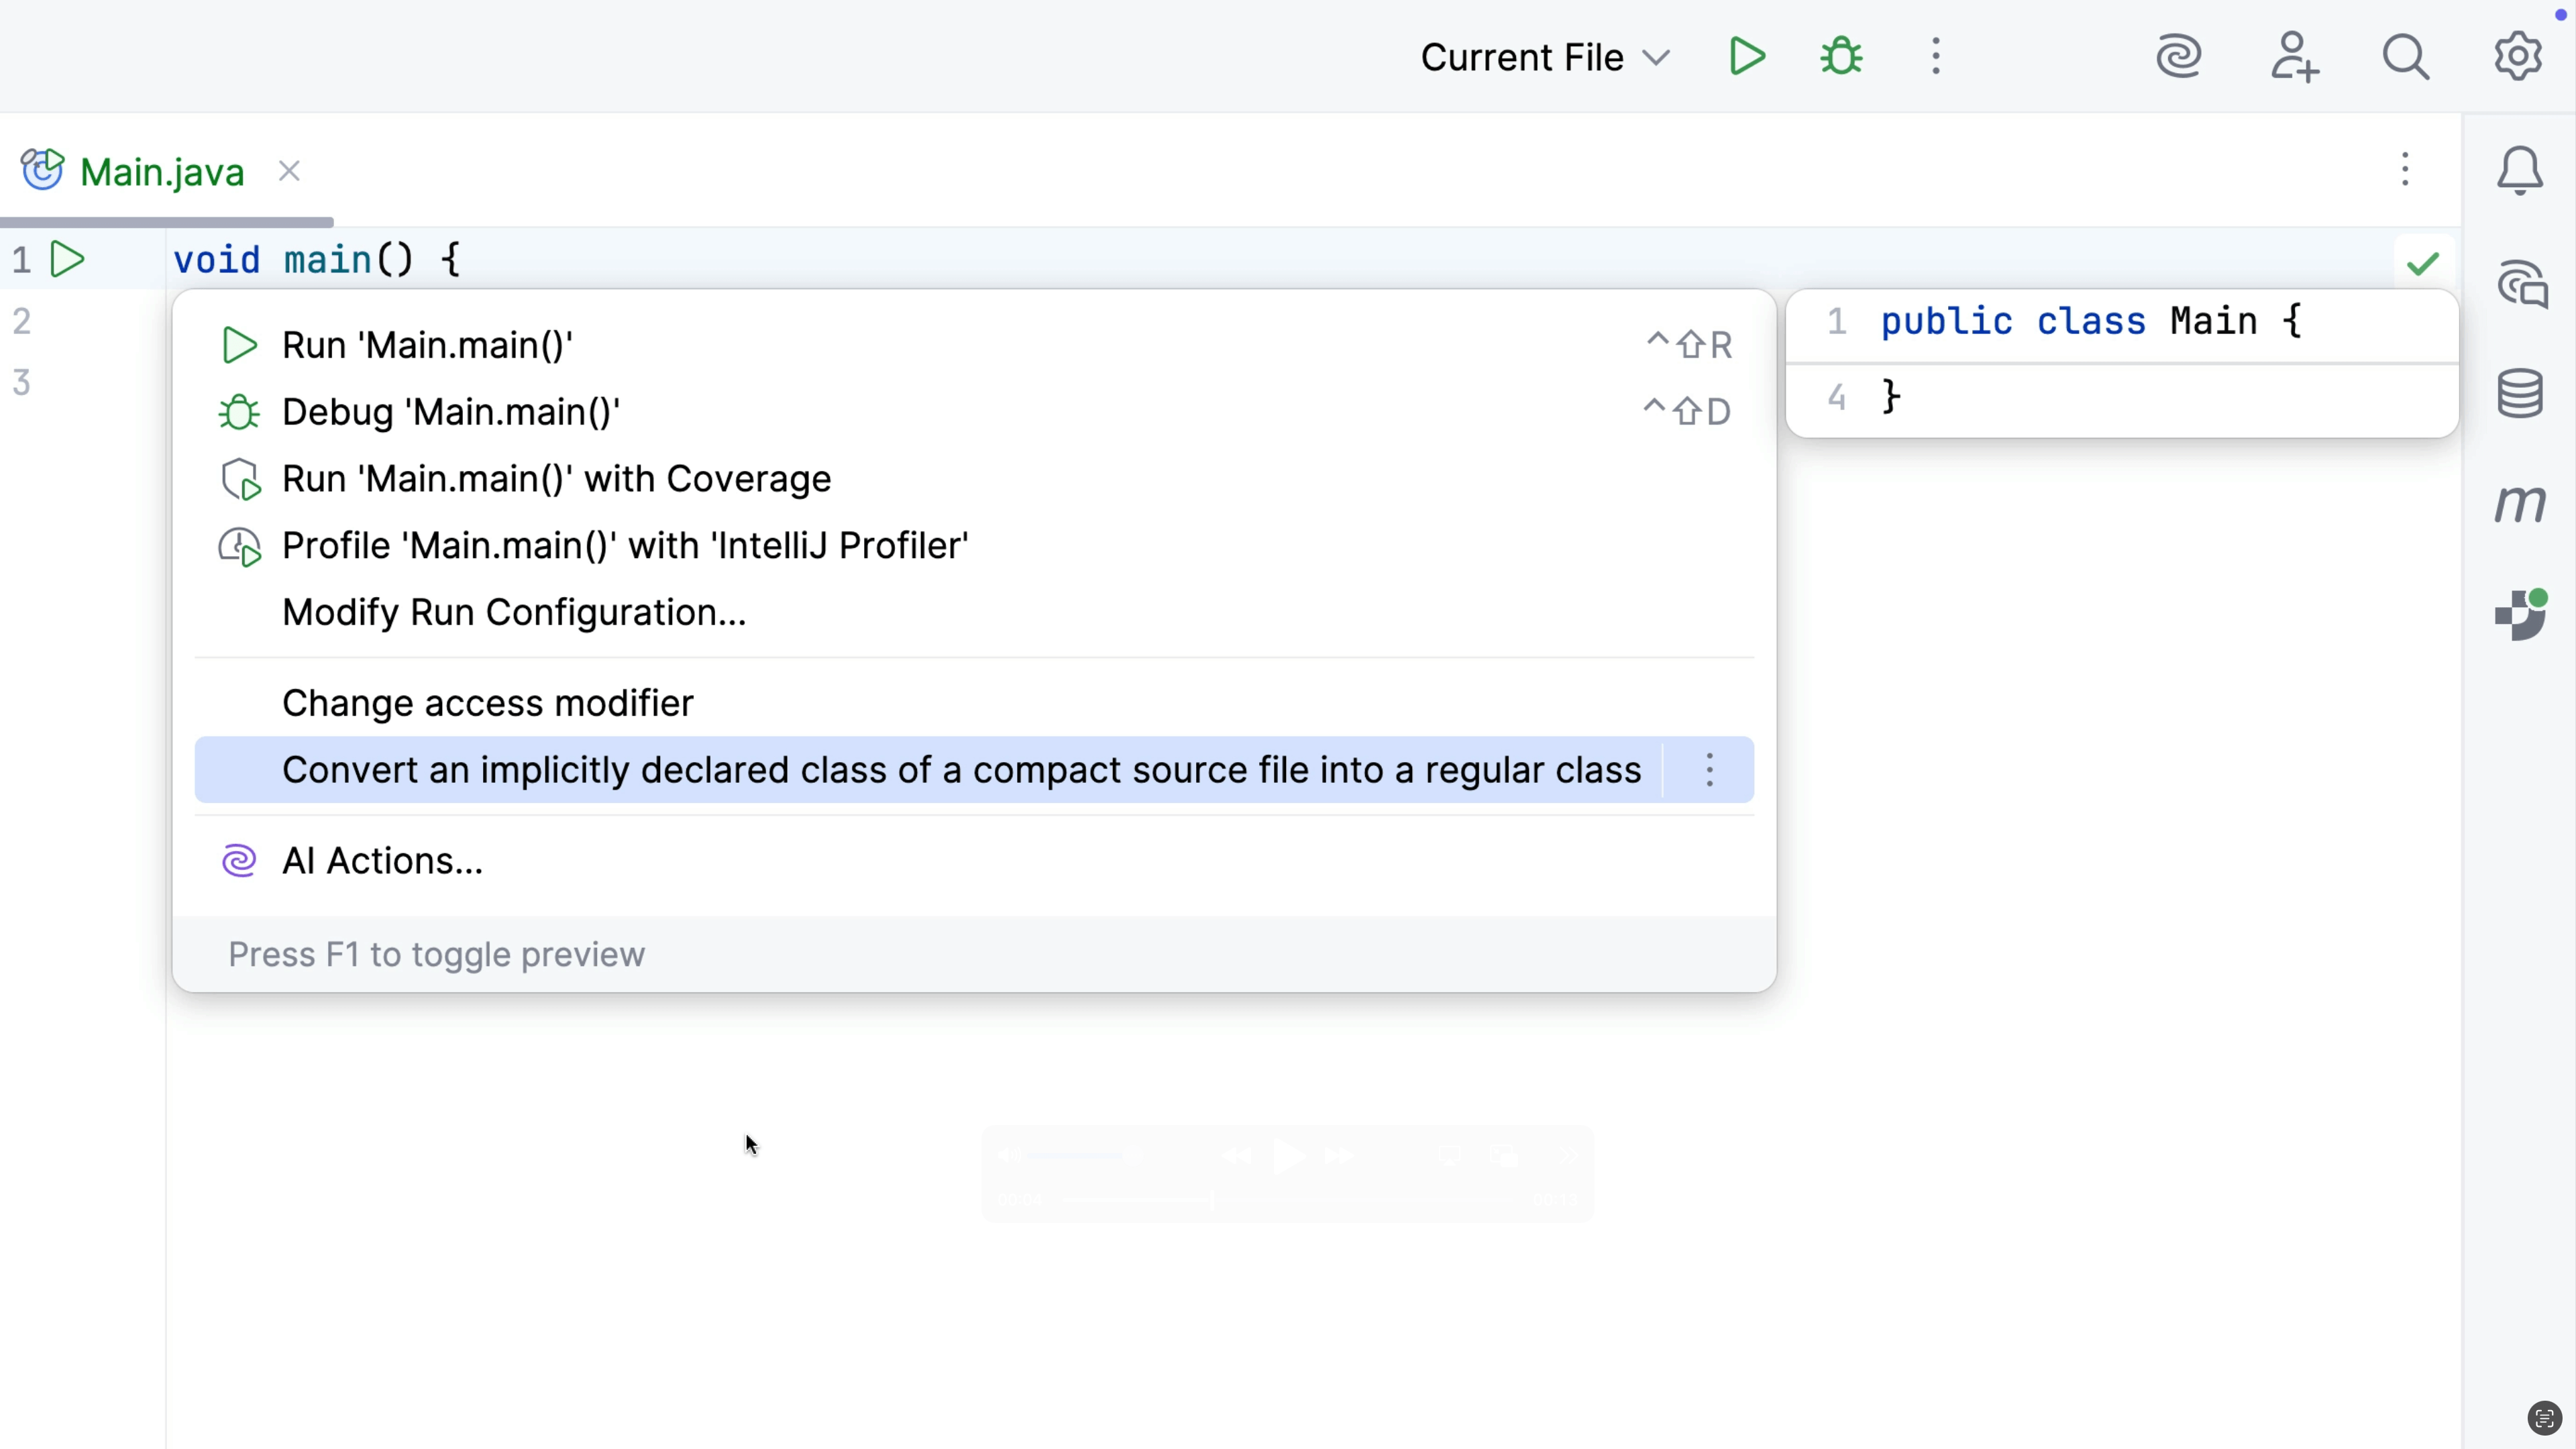
Access the profiler window using Find Action, ⌘⇧A (macOS) / Ctrl+Shift+A, or via the quick access buttons, and it shows a list of running processes
Click on a process to attach a profiler to it, for example a CPU profiler. The IDE will show the results, for example as a Flame Graph.
Click on a process in the profiler window to edit the configurations of the profilers.
Right-click on a process in the profiler window to capture a memory snapshot at this moment in time. Open this to see which objects are taking up the most space on the heap.
Right-click on a process in the profiler window to see the CPU and Memory use in real time. This is really helpful for getting a current view on what's happening in the application right now.
Find out more about the profiler in IntelliJ IDEA's help documentation.


