Debugging Streams
Visualize the flow of data through a Java stream.
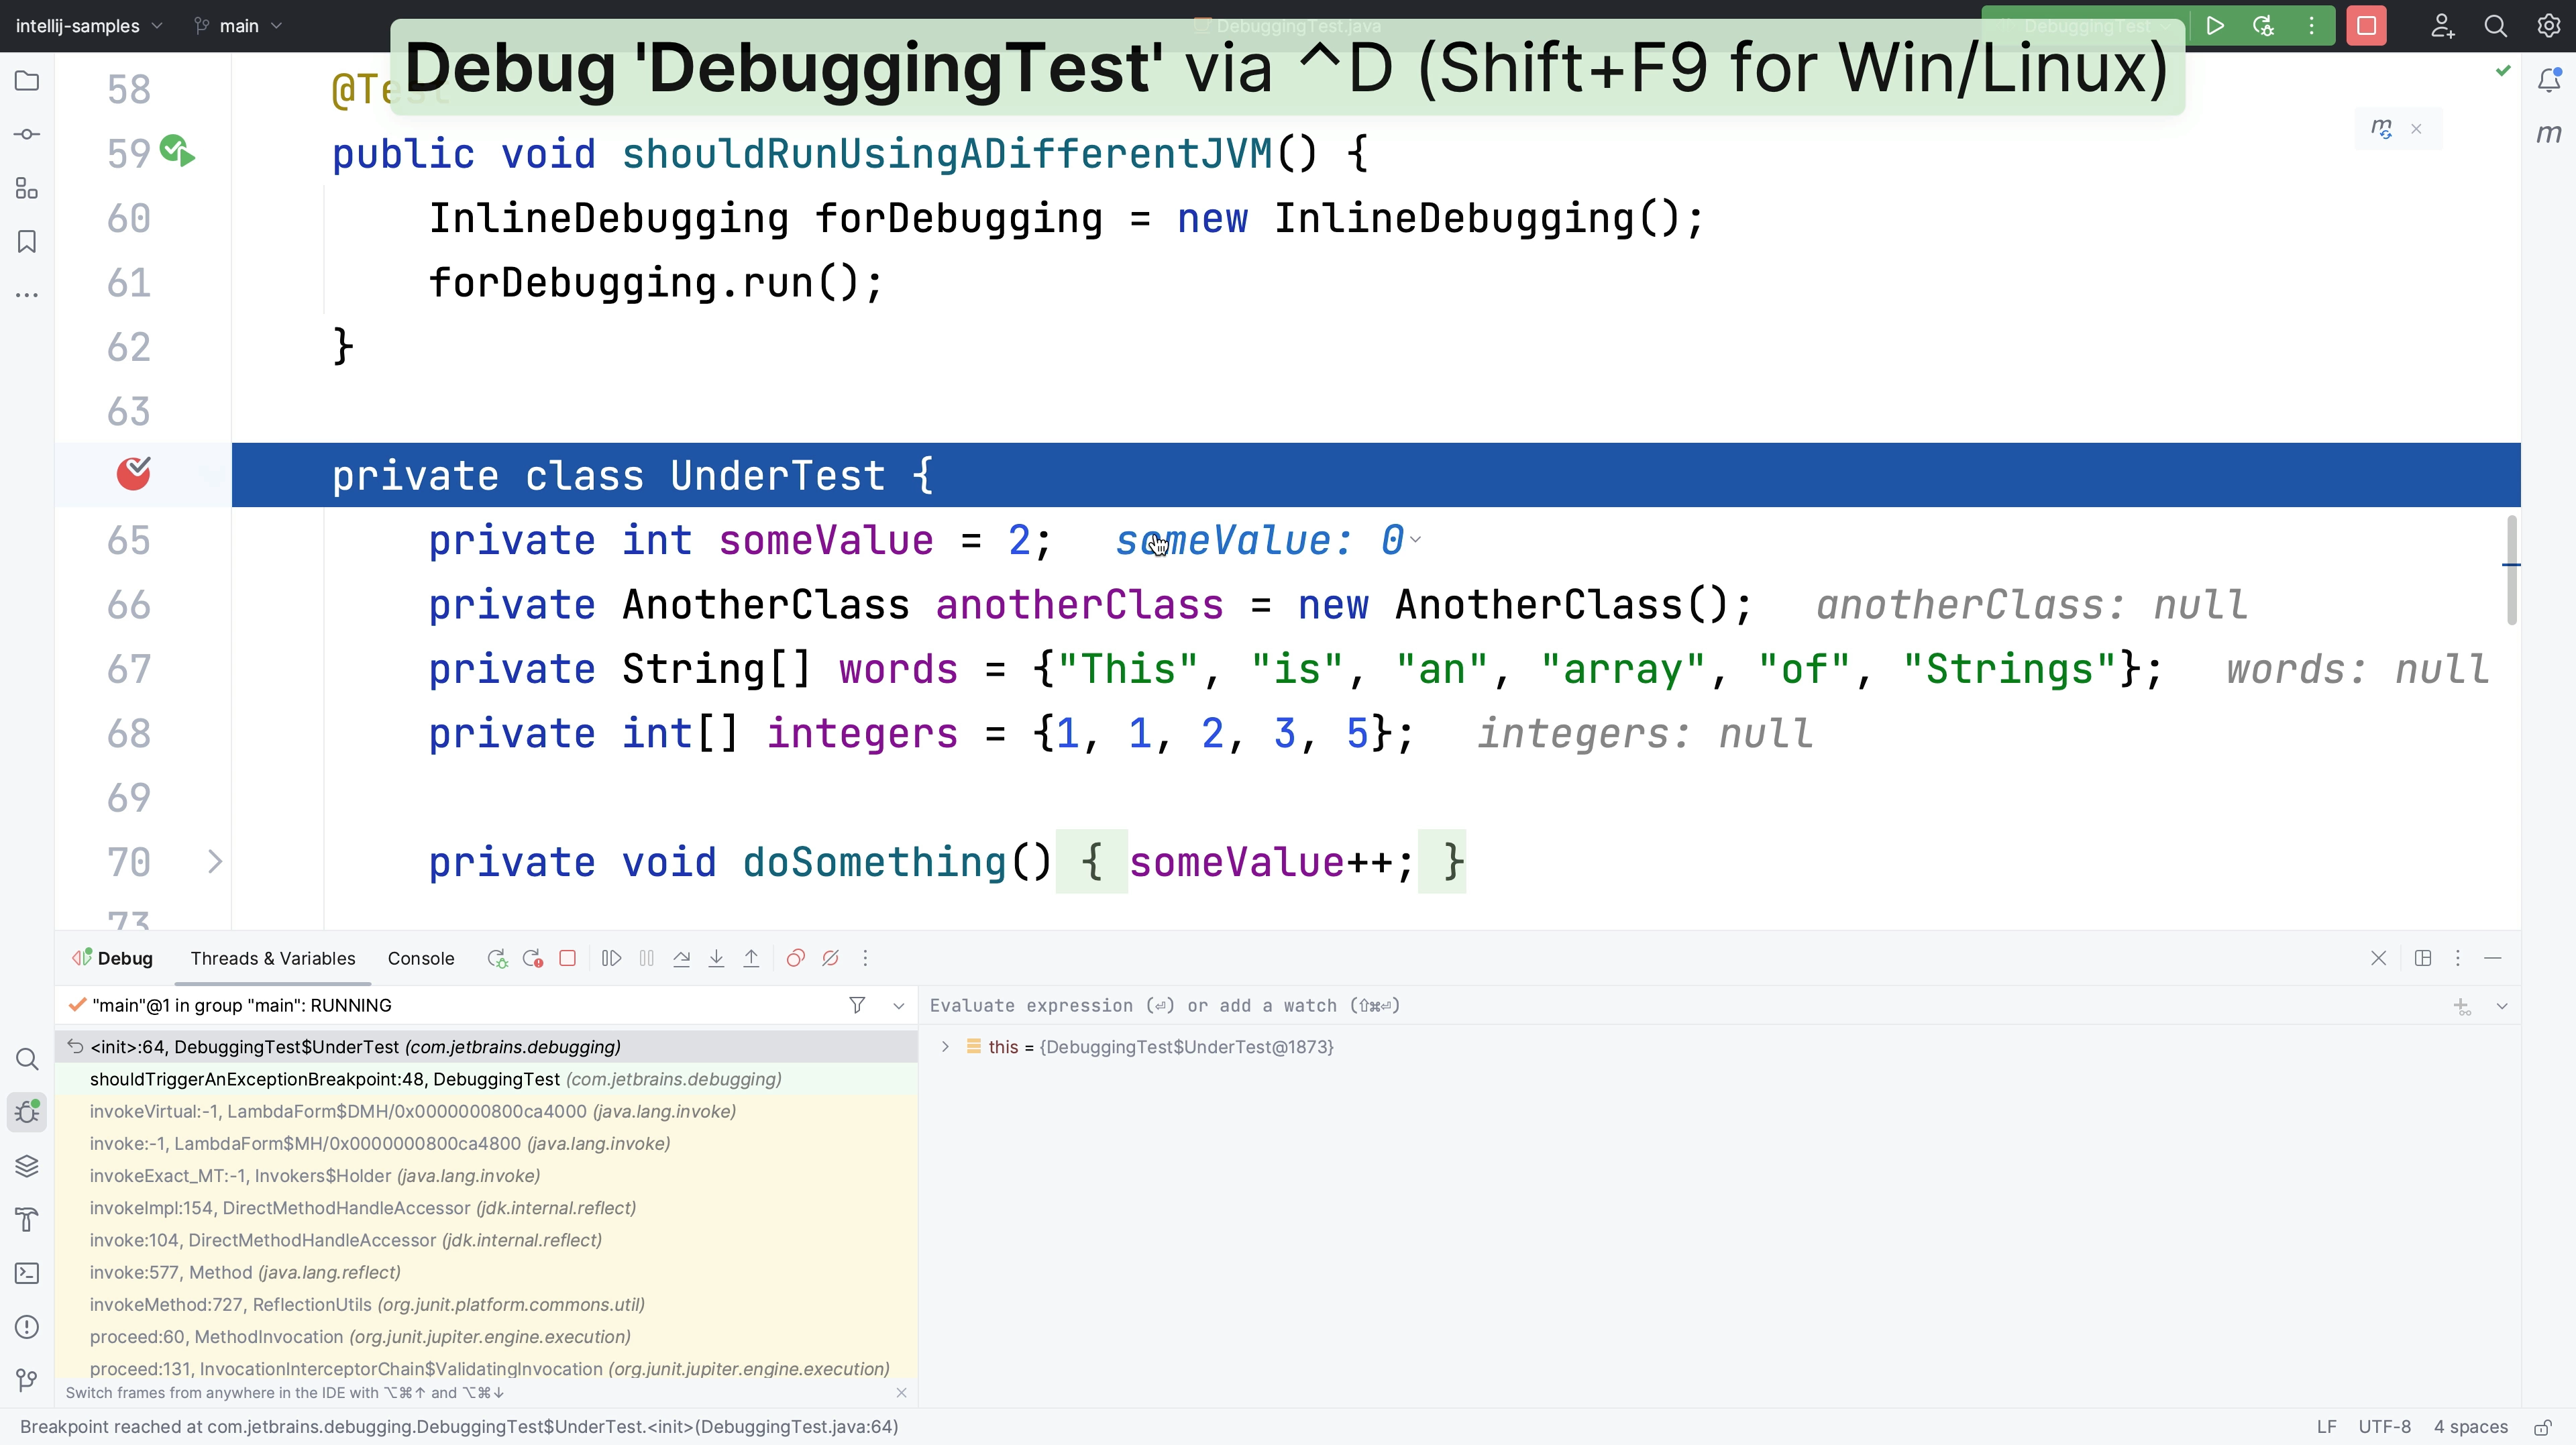
Debugging stream operations is easier if you can visualize the flow of data through your stream and see how each method manipulates it. First you need to set a breakpoint by placing your caret on line 23 and using ⌘F8 (macOS) / Ctrl+F8 (Windows/Linux). You can also do this by clicking in the gutter area next to line 23.
Run your application with the debugger ⌃D (macOS) / Shift+F9 (Windows/Linux). Again, you can click the run icon over in the gutter on the left on line 21 if you prefer.
On the right-hand side of the debug window, click Trace Current Stream Chain. This tells IntelliJ IDEA to evaluate our stream, and this is how you get your visual representation. The default view is the Split Mode which allows you to tab through each method in the operation and see how the data is manipulated. For example, when we run
the distinct method, we can see where we started on the left and over on the right with all our duplicates removed after the method has been run. In to the sorted method - now our values have been sorted in ascending order. You can also click Flat Mode which presents all the data on one screen, so you can see the whole stream operation in one place from start to finish, and you can map your data as it progresses through each operation in the stream.


