How to Use Specific Runners to Supercharge Your Builds
TeamCity bundles a great number of features that will supercharge your builds. In this tutorial, we’ll explore how to use specific runners and why you’ll want to use them.
What is a build runner and what runner types are available in TeamCity?
Build runner is a part of TeamCity that allows integration with a specific build tool (Ant, MSBuild, Command Line, and so on). A build runner provides settings that allow you to specify what building tasks to run, which building tool version to use, what Docker/Linux image to use as a container, and so on. In a build configuration, a build runner defines how to run a build and report its results. TeamCity offers many build runners out of the box, including .NET, Maven, Gradle, Docker, Python, Node.js, and many others.
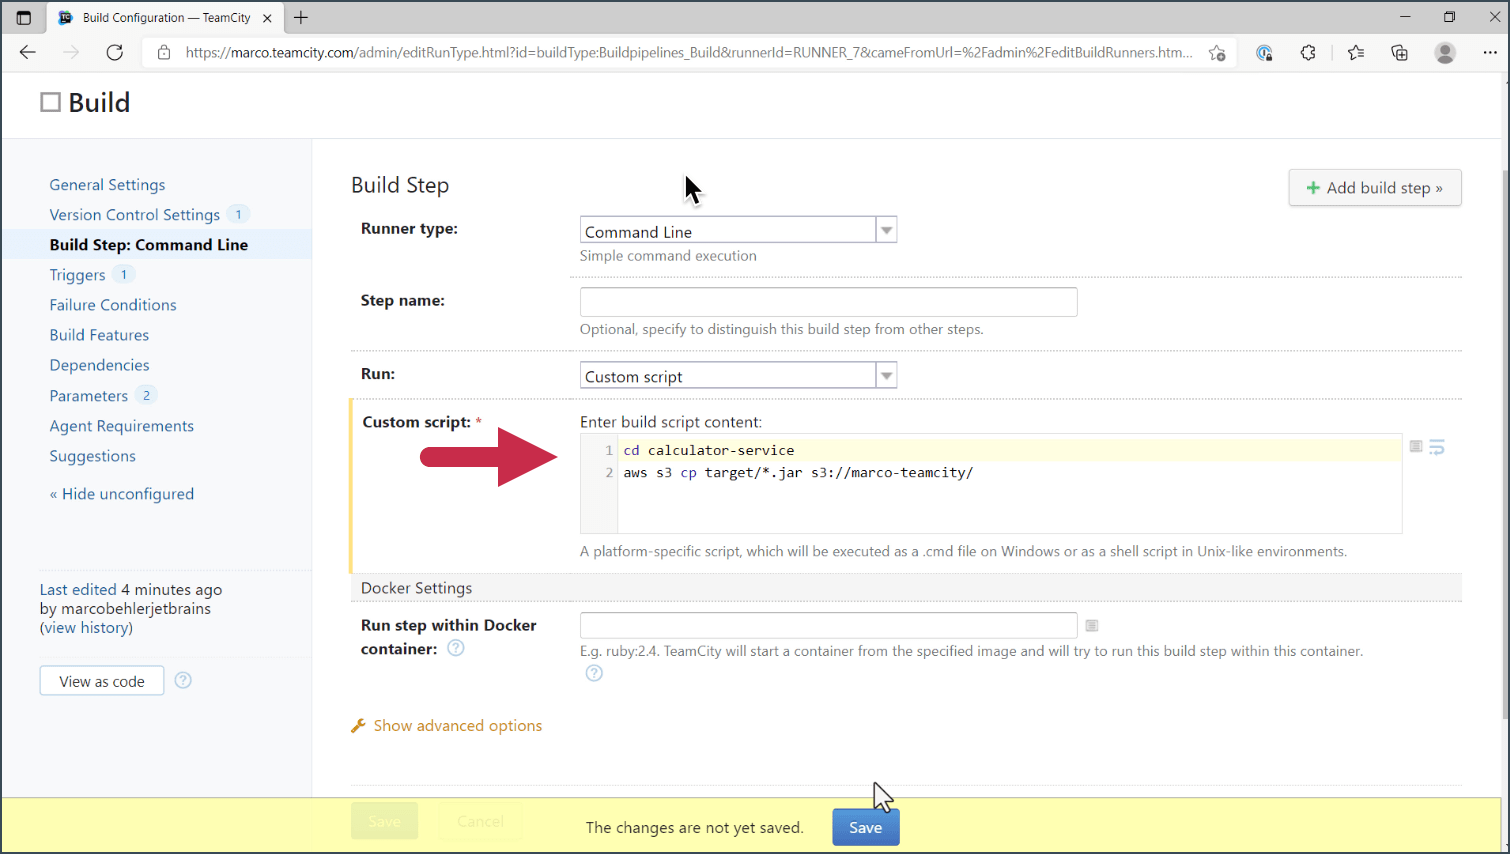
Let’s open and edit a build configuration. Here, we have one build step – a command-line build step. The script handles the following commands:
cdinto a calculator service directory.- Runs
mvn clean package - Uploads the
.jarfile to a private S3 bucket.
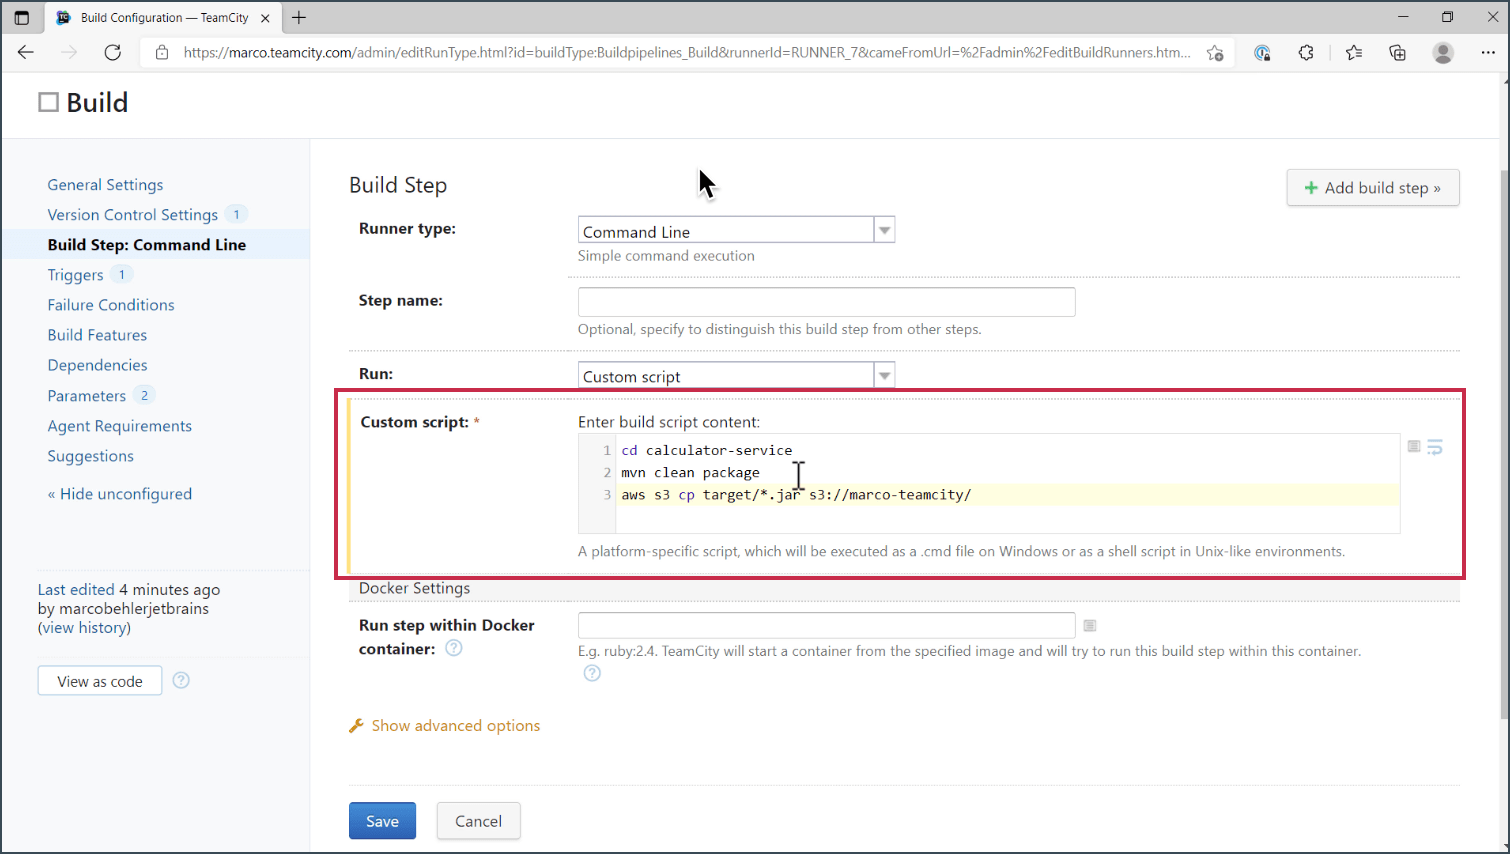
Here, we’re going to get rid of the mvn clean package step and use TeamCity’s specific
Maven features for that. We can simply remove the line in the custom script and click Save:
Adding a new build step
After that, we’re going to add a new build step. TeamCity will suggest choosing a specific runner:
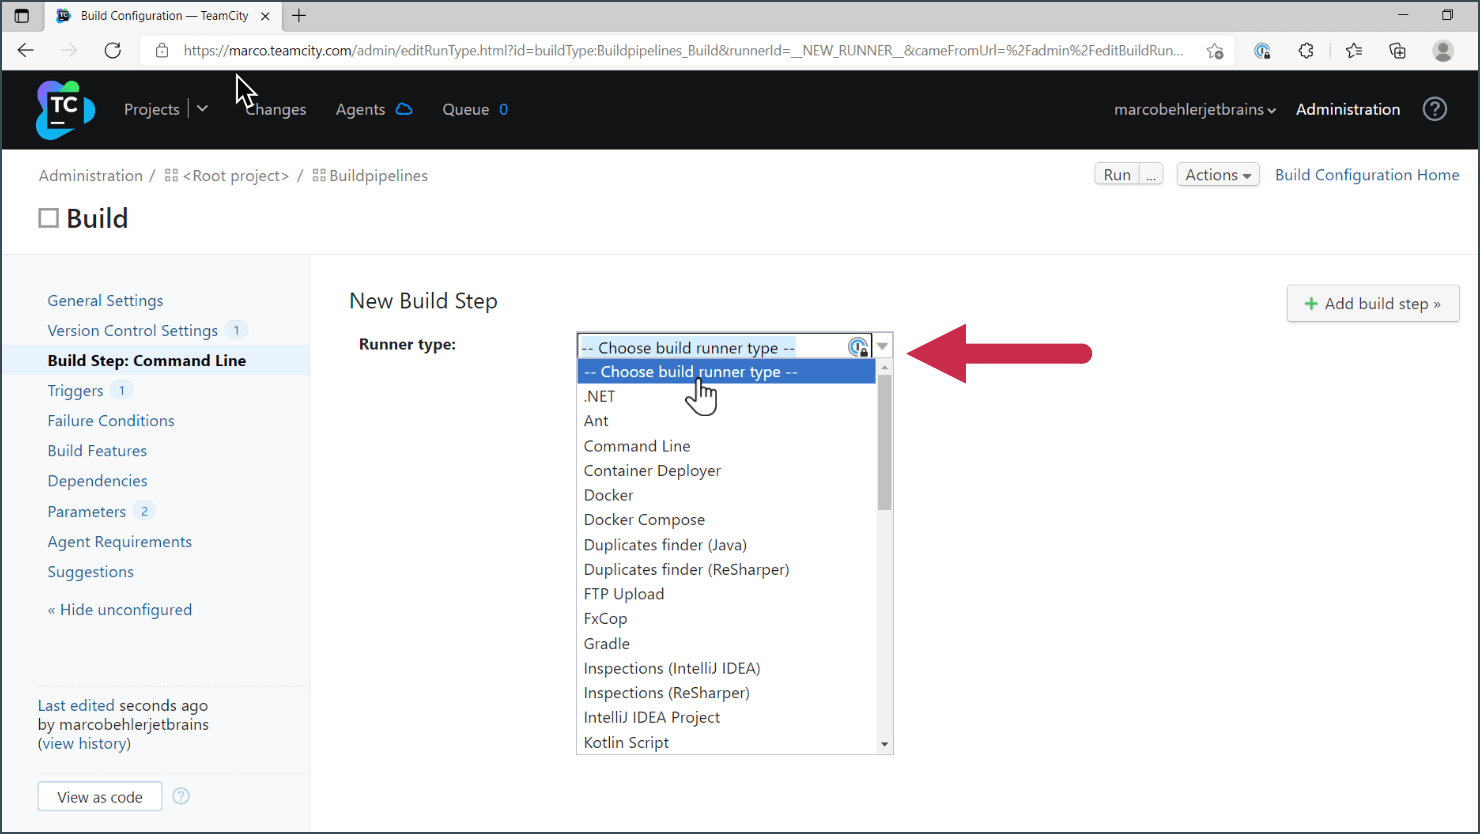
For every technology that TeamCity integrates with, you can find a specific runner. For instance, if you want to build .NET projects, you would choose a .NET runner. If you want to run command-line scripts, you'll use a command-line runner. Similarly, you’d use a Docker runner for Docker-specific steps, a Gradle runner for Gradle projects, etc.
You can find the full list of TeamCity’s build runners in the documentation.
Since we’re working with a Maven project, let’s choose Maven from the dropdown list. After that, we're going to fill out some fields that TeamCity suggests at this step.
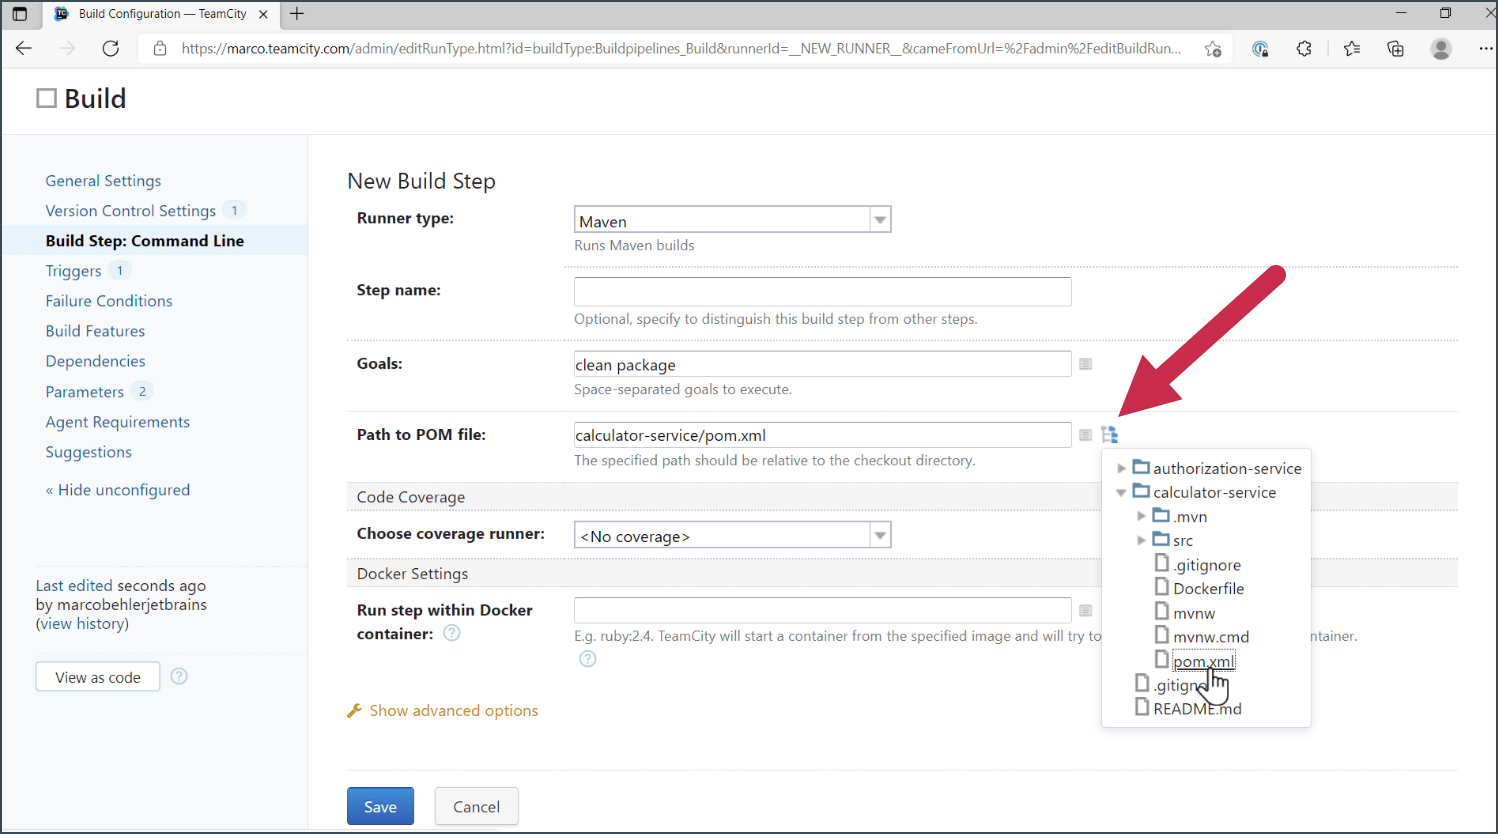
Our pom.xml file is in the calculator service directory, so we’re going to choose the
correct folder by clicking on the tree icon. Since you get a nice tree-like view of all the
directories, this prevents you from having to type the directory name (and potentially making a
spelling mistake). You can simply select the directory from the list.
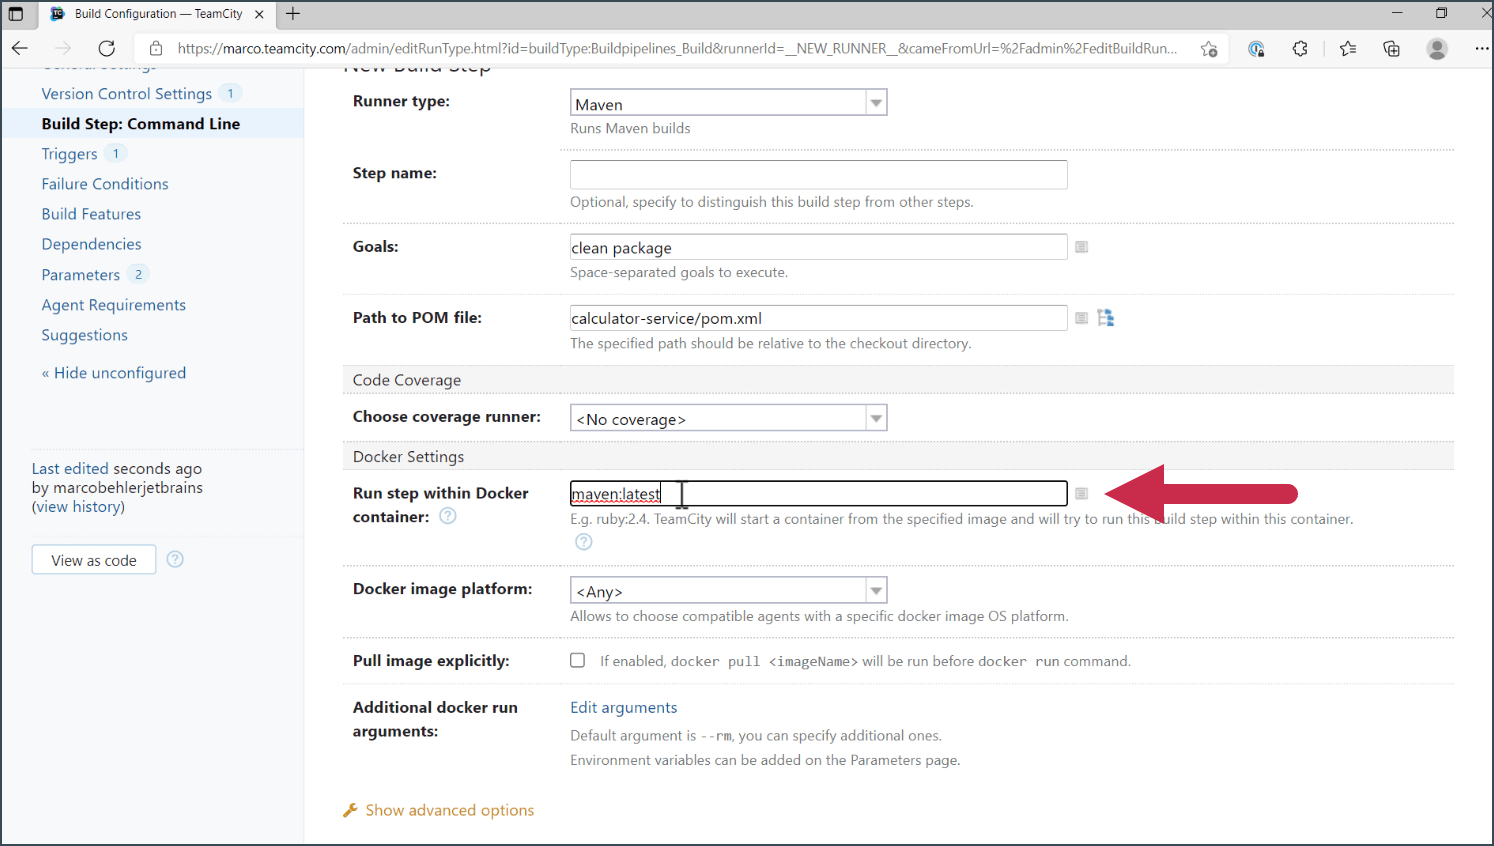
You can run the mvn clean package step inside a Docker container by providing a Docker
image name from Docker hub, for example maven:latest. TeamCity will fetch this image, transparently start a Docker container from it, run your mvn clean package goal inside, and then dispose of the container afterwards.
Choosing a coverage runner
To continue with manual build step configuration, click this link:
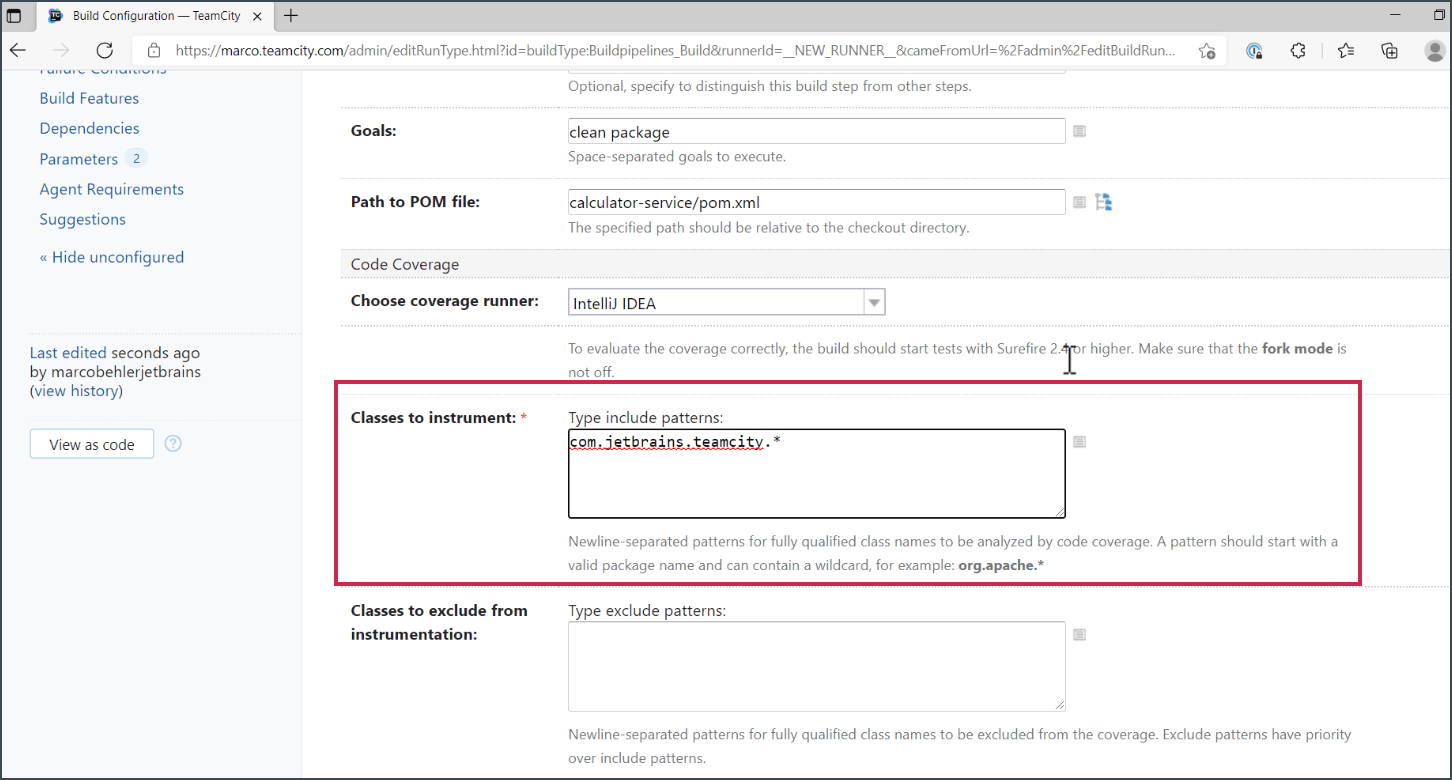
In TeamCity, you can choose a specific coverage runner. For example, you can add the IntelliJ IDEA
or JaCoCo code coverage runners, instead of alternatively hard-coding all of that inside your
pom.xml file.
Let’s add com.jetbrains.teamcity.* as a package pattern name. TeamCity will then
analyze packages whose names match that pattern for code coverage.
TeamCity also allows you to configure advanced options. For example, you can choose different Maven project versions or select a specific Java version to run the whole project.
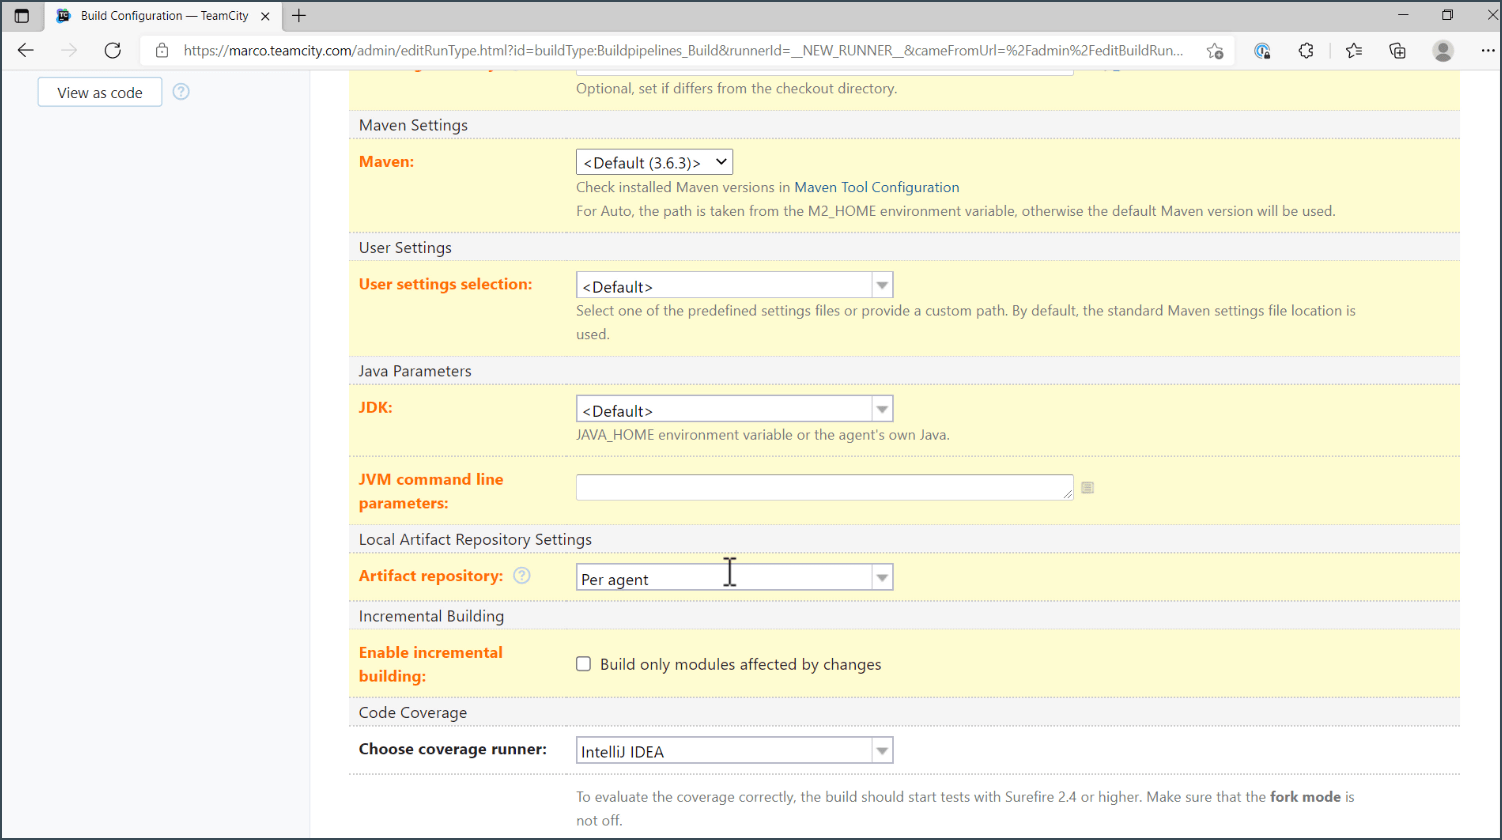
With all these UI options, you don’t have to worry about whether your command-line invocation is going to work. TeamCity will take care of it for you.
Now, we have the command-line script running and the Maven step that comes afterwards. We want to
reorder our build steps so that mvn clean package runs first and then the command-line
upload to S3 happens.
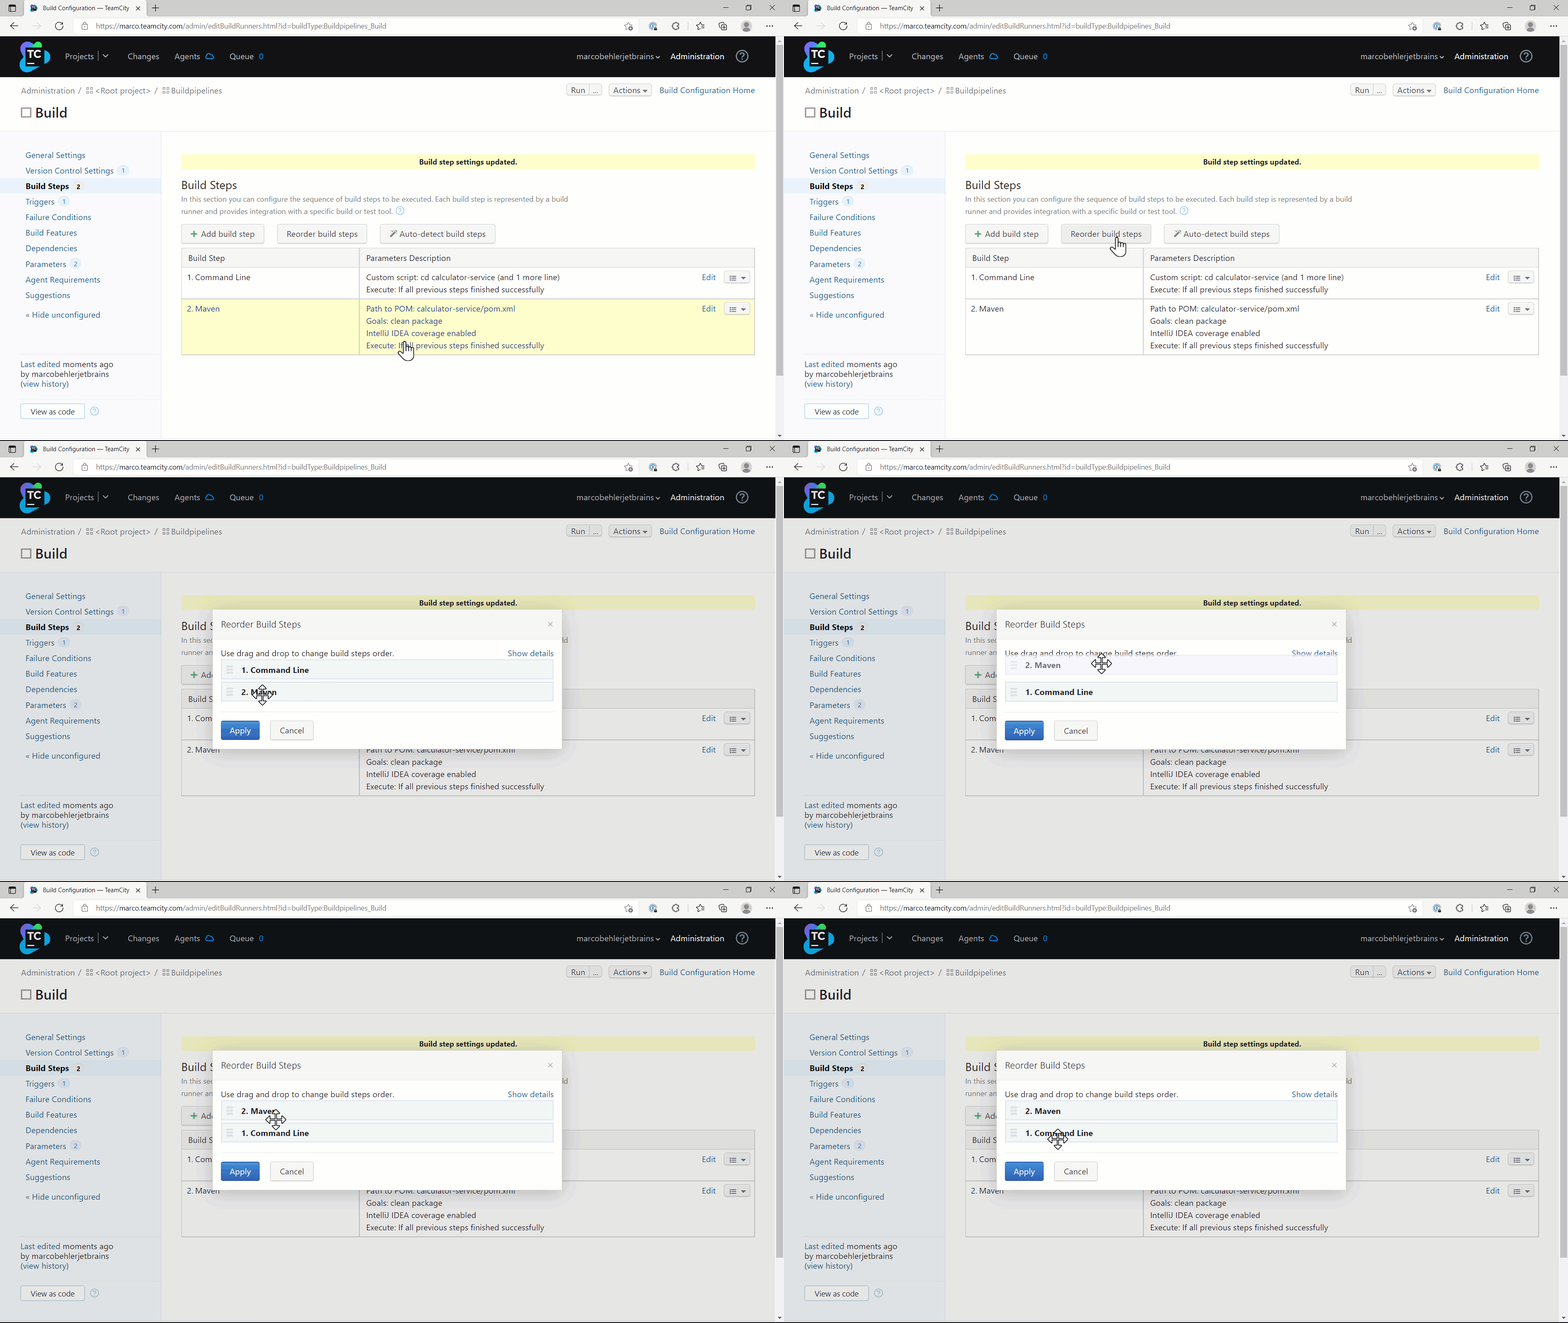
After that, just click Run, and everything should work as expected.
What does the Maven runner enable us to do?
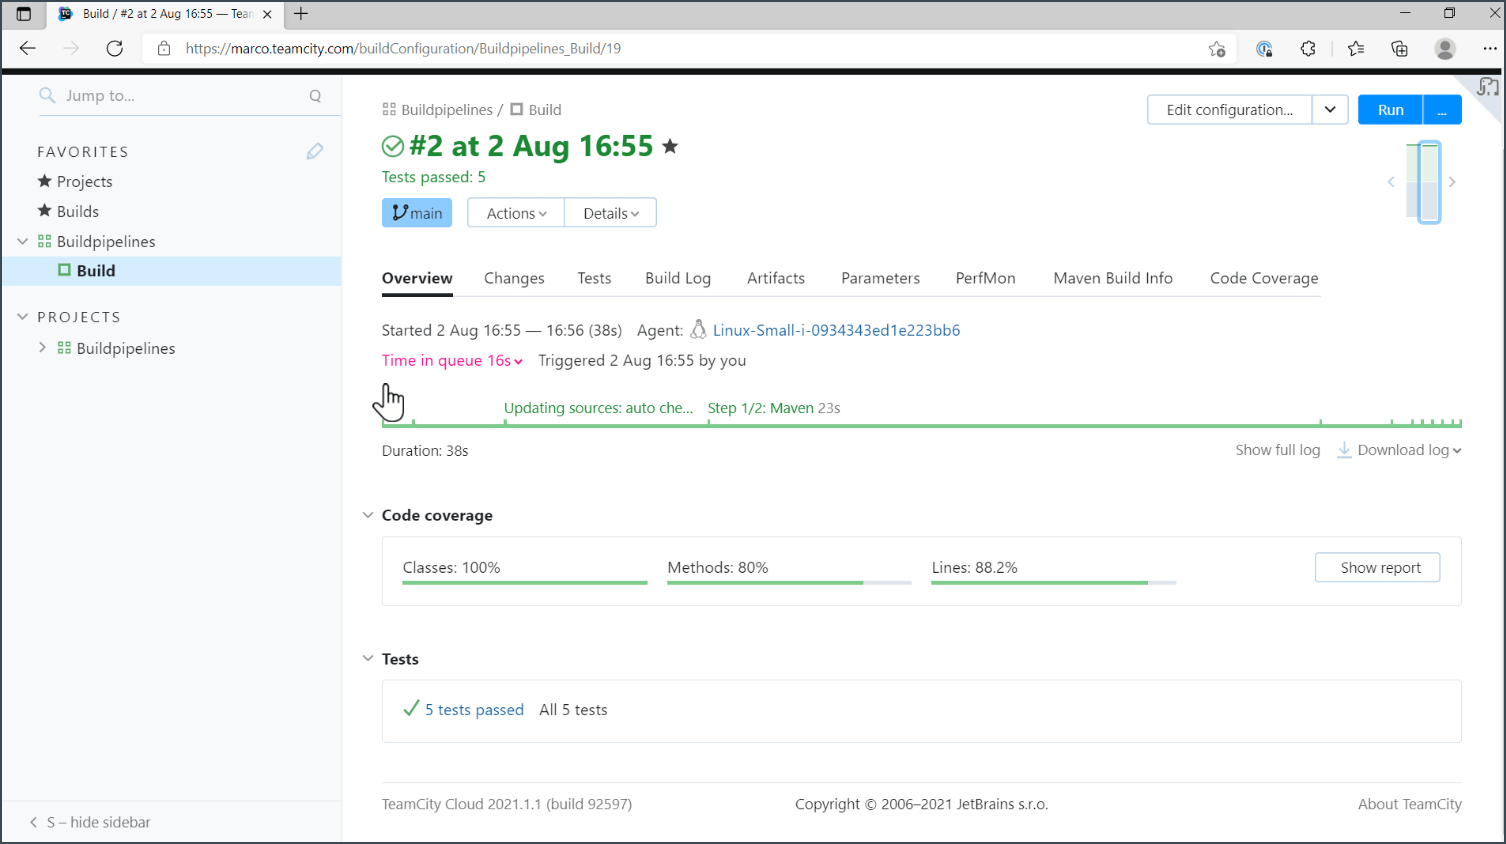
Once the build finishes running, you can access the build overview page. Here, you’ll notice new tabs like Maven Build Info and Code Coverage, as well as a new section for Tests and Code Coverage results.
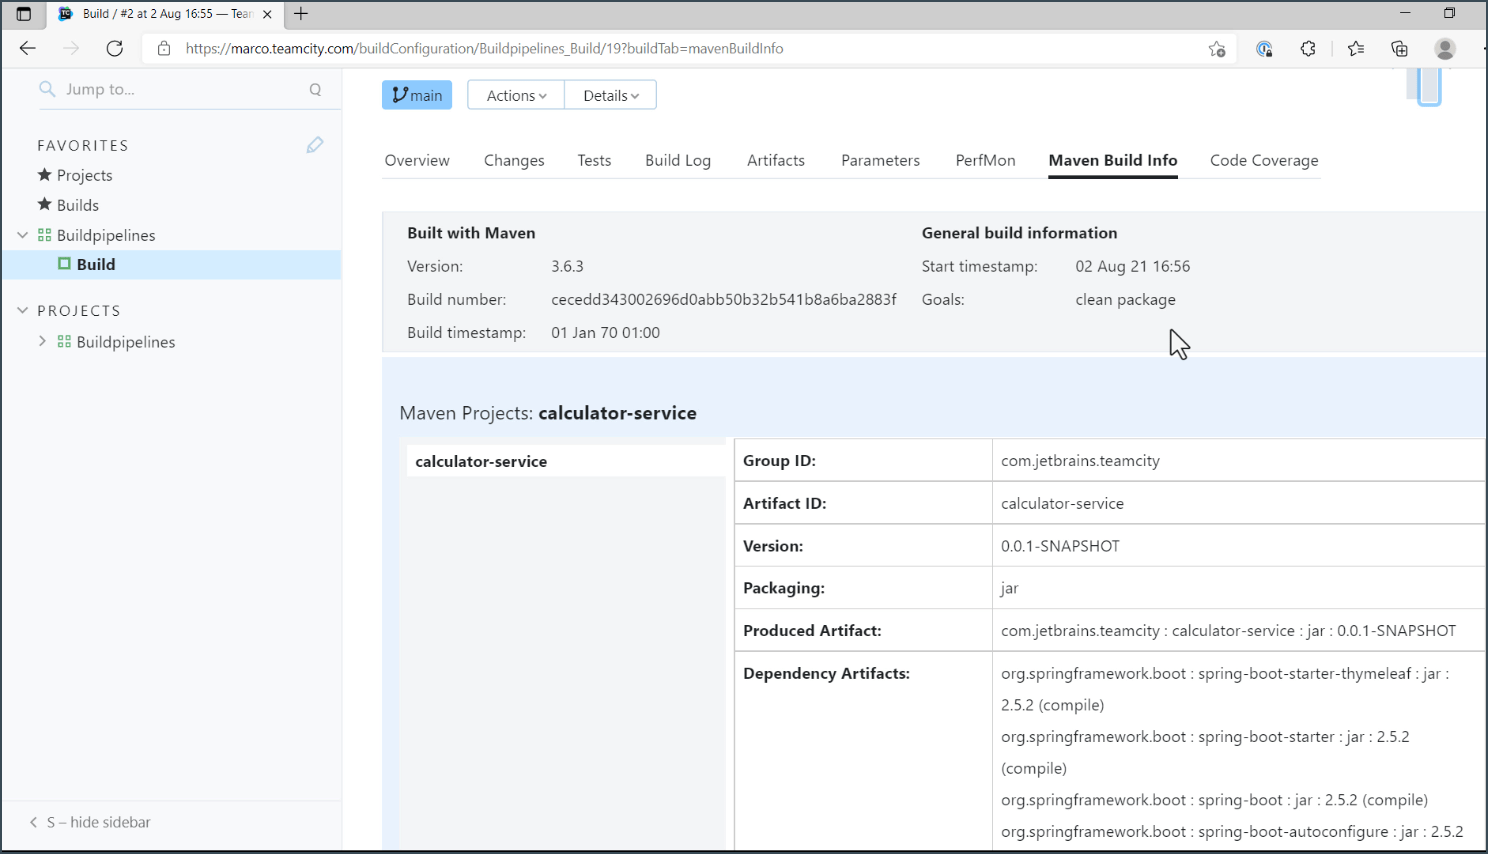
Maven build info
On the Maven build info page, you’ll get an overview of what goals you’ve executed with which
specific Maven version. You’ll also see the produced artifacts, like the .jar file that
Maven produced.
The report also shows you all the specific dependencies with their versions that Maven pulled in for this specific build. This gives you an overview of what libraries your build consisted of. It’s also helpful for debugging purposes.
You'll also see all the effective Maven plugins that were activated during that build.
Test overview page
The test overview page, which you get for free by using the Maven runner, provides you with a lot of useful information. Here’s what you can see in the report:
- Overall Test status (Successful, Failed, Flaky, etc.)
- Test classes and methods executed
- Test durations
- The order in which the tests ran
Every test also has a test history that provides you with all the essential information about the test. Test history is helpful when you need to investigate problems that might arise with tests, like “Why does this test suddenly take longer? Is it a flaky test?” and similar.
We cover test reports in detail in this video.
Code coverage report
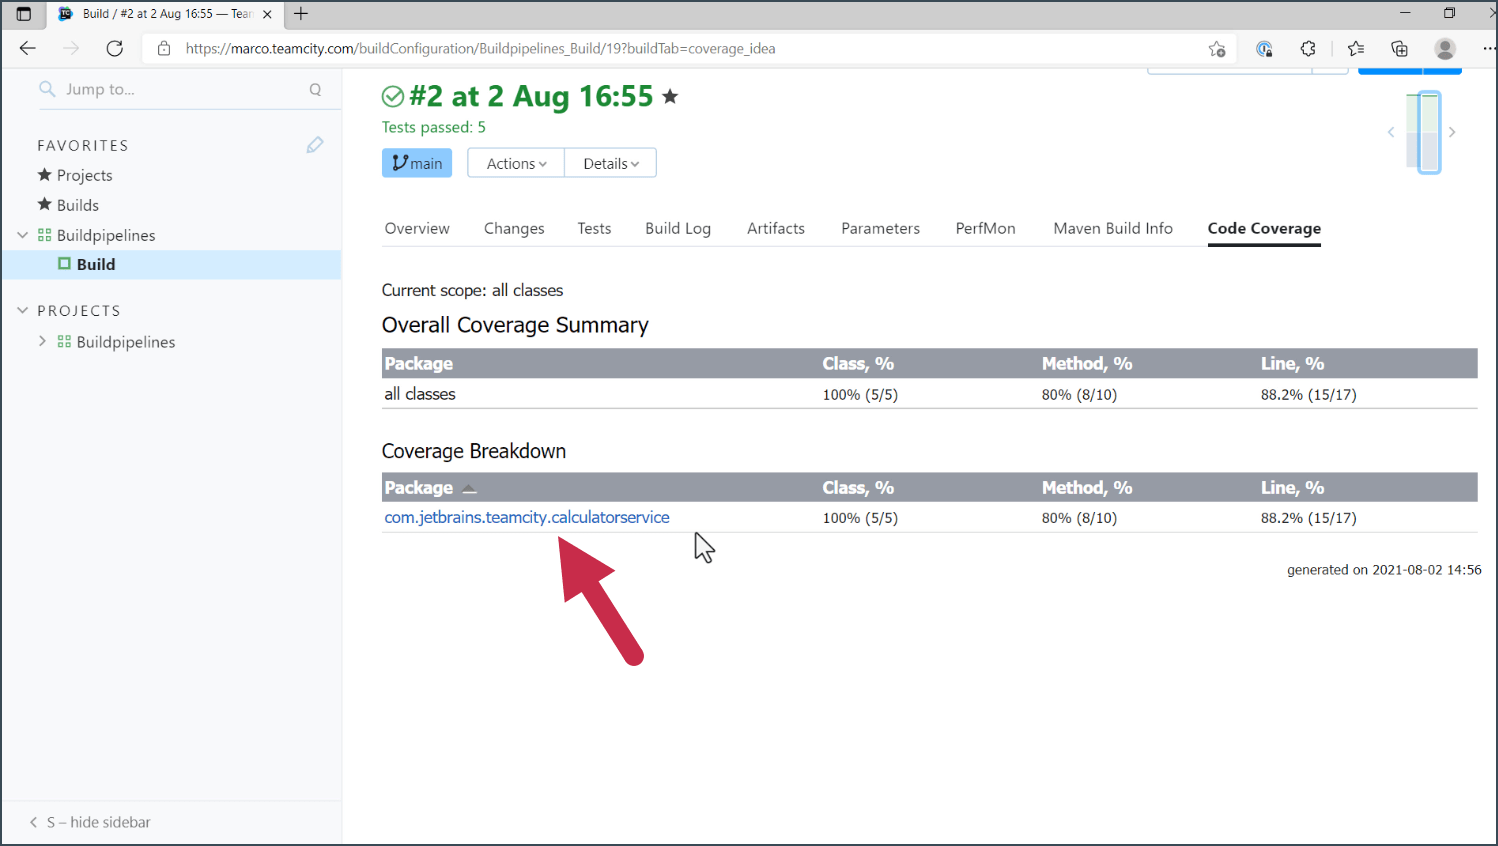
The code coverage report provides us with information about the classes and methods used, as well as the percentage of code covered by tests.
All you have to do is select a couple of dropdown options in the IntelliJ IDEA code coverage runner to get all these reports in the TeamCity UI.

That’s all for now! Watch other tutorials to learn how to make use of TeamCity-specific features, like test reports or code coverage reports.
Happy building!
