Explore and navigate exception stack traces
ReSharper | Tools | Browse Stack Trace
Ctrl0E,0T (ReSharper_ExploreStackTrace)
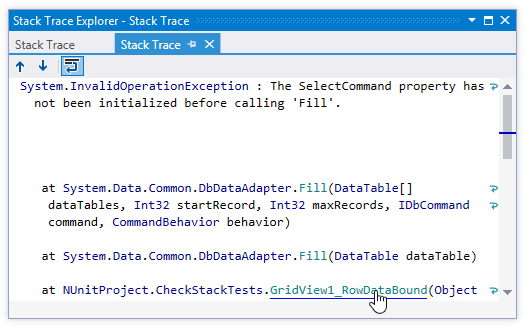
When you receive an external stack trace (for example, from a bug report), you can open it in the dedicated Stack Trace Explorer window and then navigate to code where the corresponding exception originated. In this window, you can click files, types, and methods to display them in the editor.
Each stack trace is opened in a new tab, which stays available until you close it or close the solution. If you close the Stack Trace Explorer window, you can reopen it by choosing ReSharper | Windows | Stack Traces from the menu.
Copy exception stack trace to the clipboard.
By default, if you copy a stack trace that contains symbols from the currently opened solution and then switch focus to Visual Studio, ReSharper will automatically load it to the Stack Trace Explorer window and bring it to the view. If you do not like this behavior, clear the Auto open external Stack Traces checkbox on the Tools | Stack Trace Explorer page of ReSharper options Alt+R, O. If auto-opening is disabled, use the shortcut or menu command as described below.
Press Ctrl0E,0T or choose ReSharper | Tools | Browse Stack Trace from the main menu.
The Stack Trace Explorer window opens displaying the exception stack trace from the clipboard in a new tab.
Study the stack trace and click highlighted items to open the corresponding code in the editor.
If you prefer to wrap long lines in the stack trace, use the corresponding toolbar button
.png) or specify the default preference for line wrapping on the Tools | Stack Trace Explorer page of ReSharper options Alt+R, O.
or specify the default preference for line wrapping on the Tools | Stack Trace Explorer page of ReSharper options Alt+R, O.

Control | Name | Description |
|---|---|---|
| Previous/Next | Navigate to the previous/next item and scrolls through the source code accordingly. |
| Toggle wrapping of words | Allows you to enable or disable wrapping of long lines in the sack trace. You can specify the default preference for line wrapping on the Tools | Stack Trace Explorer page of ReSharper options. |
When stack traces open in the window, they are displayed in new tabs, which show up on the left. The previously open tabs move to the right if the width of the window allows, otherwise they unload themselves saving memory - but you can always restore them by clicking the arrow that appears to the right of the tabs and clicking the required tab:

To prevent a tab from unloading, click the pin icon ![]() next to the tab title.
next to the tab title.