Analyze test results
Before running coverage analysis or performance profiling, make sure that the PDB information exists for all target assemblies. The safest choice would be to build your code with the Debug build configuration.
Analyze execution results and output
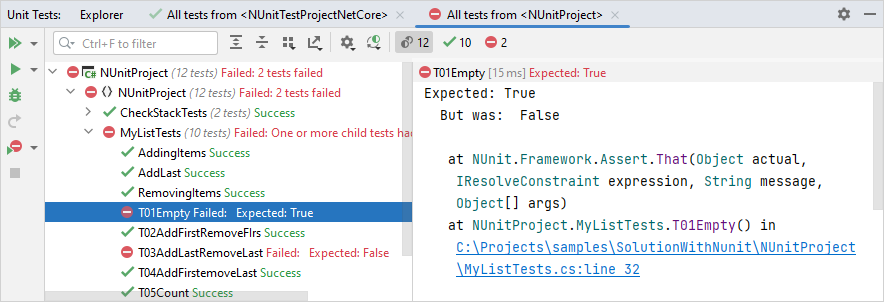
When test execution is over, the results are visualized in the Unit Tests window.

The output pane (which you can place on the right or at the bottom using the Toggle output position ![]() button on the toolbar) displays output of the selected test. If the test is failed, JetBrains Rider also adds short information on the failure and/or displays the stack trace of an exception. You can use clickable links in the output pane to navigate directly to types and methods involved with the failure.
button on the toolbar) displays output of the selected test. If the test is failed, JetBrains Rider also adds short information on the failure and/or displays the stack trace of an exception. You can use clickable links in the output pane to navigate directly to types and methods involved with the failure.
By default, JetBrains Rider wraps long lines in the output according to the current width of the output area. If necessary, you choose not to wrap long lines by clearing the Wrap long lines in Unit Test Session output checkbox on the page of JetBrains Rider settings Ctrl+Alt+S.
Use the Group by selector on the toolbar to change grouping of the tests — you can either choose one of the predefined grouping modes in the upper part of the selector, such as Test Hierarchy, Project Structure, and so on, or use the lower part of the selector to choose a custom set of grouping properties.
On the status bar, you can see the total number of tests in the session as well as number of tests in different states:
![]()
By default, tests in all states are shown, but you can click the corresponding icons to filter tests by their state.
Status of each test in the Unit Test Sessions window is displayed with one of the following icons:
| Unit test is currently executing |
| Unit test is scheduled for execution in the current run |
| Unit test was not executed |
| Unit test passed in the lats test run |
| Unit test failed in the lats test run |
| Unit test was ignored in the last test run |
| Unit test was started but JetBrains Rider could not read the test runner output. This normally happens when you abort test execution, but could also be a sign of an error occurring in the test runner. |
The same icons are used to display status of grouping items (classes, projects, and so on)
The icons are also used on each session's tab to display the overall execution result of the sessions.
The corresponding icons above the test session tree show how many tests are in each of the states. The ![]() icon shows the total number of tests in the session.
icon shows the total number of tests in the session.
Using these icons, you can filter the tree so that only tests in the corresponding status are displayed.
When your focus is in the Unit Tests window, you can use simplified shortcuts for unit testing actions. For example, you can use Ctrl+D instead of Ctrl+;, D for debugging selected tests. Here is the full list of extra shortcuts that work in the Unit Tests window:
Shift+Enter — Run Selected Tests
Ctrl+D — Debug Selected Tests
Ctrl+Y — Run Current Session
Alt+Shift+Insert — Create New Session
Ctrl+Alt+Insert — Append Selected Tests to Session
Delete — Remove Selected Tests
Ctrl+L — Run All Tests from Solution
Study execution log
Unit Tests window includes test execution log that lets you separate problems related to test execution process from unit tests results.
You will normally need to check execution log if some of your tests have the 'Inconclusive' state after execution, which could be a sign of an error occurring in the test runner.
To open the execution log, click Session Options on the toolbar and choose or .
Compare files from test output
To access the integrated diff tool from the test output, write the paths to the compared files in a test output line that matches the following regex:
For example:
In the test output, the line will be replaced by a link that you can click to see the diff:
