Debug modules that have no debug information (PDB)
With ReSharper, you can debug any compiled module, even if it does not have debug information (PDB). ReSharper will decompile the module, generate PDB for it and automatically load decompiled symbols for this module into the Visual Studio debugger.
Prerequisites
Prior to debug modules that have no PDB, check the following settings:
ReSharper: on the options page, make sure that the Debugger Integration checkbox is selected.
Visual Studio: on the options page, make sure that the Cache symbol in this directory field has a valid disk path value.
Visual Studio: on the options page, make sure that the Enable Just My Code checkbox is cleared.
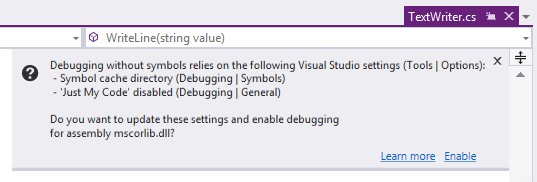
However, even if one or both of these settings do not have expected values, ReSharper will suggest to correct these values automatically when you try to load symbols from decompiled modules. In this case, it will add %LOCALAPPDATA%\Temp\SymbolCache as the symbol cache directory.
Debugging
Before debugging your program or after debugging has started, you need to load symbols for each compiled module that you want to debug. You can do it in one of the following ways:
In the debug mode, open the Visual Studio's Modules window (), select one of several modules, right-click the selection, and choose Load Symbols with ReSharper Decompiler.
In the Process Explorer window (), select one of several managed modules, or one or more processes, and choose Enable Debugging in the context menu. If you choose processes, ReSharper will generate and load non-existent PDB for all managed modules in the processes.
Navigate to the desired symbol in the compiled modules, and set a breakpoint in the decompiled source. If symbols for the module where you set the breakpoint are not loaded yet, ReSharper will display a popup where you can enable debugging for this module:

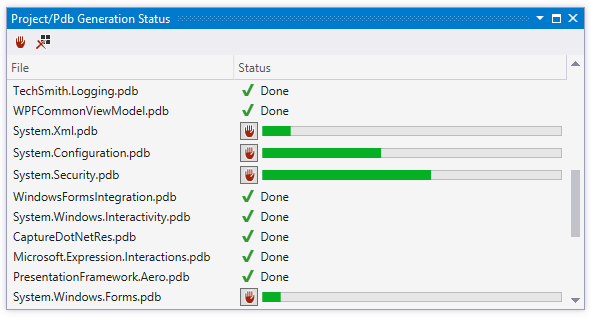
Decompiling and loading symbols may take some time, so after you initiate the process in one of the above ways, ReSharper displays the progress in the Project/PDB Generation Status window.

When debugging optimized assemblies, some debugger functions are just not available, for example you would not see values of local variables, even if symbol files are correct. So you might want to disable the optimization.
Check if the assembly is optimized when Visual Studio is in the debug mode — open the Modules window () and check the Optimized column.
Select Suppress JIT optimization on module load checkbox in Visual Studio options ().
To disable the use of all NGEN (pre-JIT) images (*.ni.dll), you can set the environmental variable
COMPLUS_ZapDisable=1. Check out these articles for examples and more information:
Potential problems
If an assembly was built without the debug directory, Visual Studio debugger will not be able to map symbols in the assembly, even if PDB is regenerated.
For example, such assemblies might be created in Visual Studio when None was selected in the project properties (), which means that neither PDB nor the debug directory would be generated for the assembly.
If you try to debug such assembly, this problem will be reported in the PDB Generation Status window.