Analysis of Includes
Long build times caused by huge hierarchies of includes is one of the biggest problems in large real-world C++ projects. ReSharper has a few features to help you with optimizing includes in design time. For example, it will mark unused #include directives or automatically create forward declarations for unresolved names instead of including the headers with the required declarations.
To address the includes hierarchies problem in a more systematic way, ReSharper provides Includes Analyzer, a code inspection tool that helps you locate and eliminate unnecessary header dependencies.
How is it helpful?
A typical project might contain many thousands of #include directives, and it is not clear which of them are worth investigating. Includes Analyzer attempts to estimate the contribution of each header file to the build time, based on the number of lines of code that it adds to the total compilation workload. While this is not a precise metric, it is a useful starting point to find and prioritize the most included header files.
After you identify the header dependencies that potentially have the biggest impact, you can try getting rid of them one by one via the standard approaches, for example:
using forward declarations wherever possible,
removing unneeded
#includedirectives,applying the Pimpl idiom,
splitting large header files into smaller ones.
One important limitation of Includes Analyzer is that ReSharper does not actually run a full preprocessing stage in order to speed up the analysis process. This means that the line count does not in fact include the results of macro expansions, and that include guards do not get handled as well. Instead, ReSharper assumes that each header file starts with an include guard or a #pragma once directive, and gets included at most once in any source file. Each successive include of the same header does not count towards its number of contributed lines, which means that sometimes you may encounter Times included and other metrics equal to zero next to an internal tree node.
Starting the analysis
To start the analysis, invoke one of the actions from the main menu, or select Analyze Includes from the Solution Explorer context menu.
ReSharper will analyze the files in the given scope and present a report in a dedicated tool window, where you can explore the dependencies between the files. The Includes analysis window provides two separate views, Includees and Includers, both of which present include dependencies as a tree where each node corresponds to a file. You can switch between these views via the corresponding toolbar buttons, or by navigating to the same file in the other view from the context menu.
Includees view
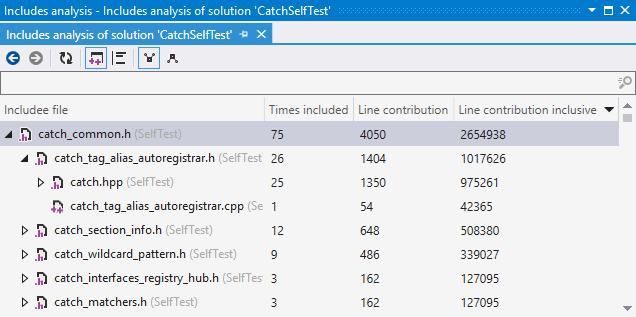
The Includees view helps you understand how many lines of code the header file in a top-level tree node contributes to all source files that directly or indirectly include it. Child nodes in this view represent files that include the file from the parent node. Consider the following analysis of the entire Catch2 solution:

There are three metrics for each node in the tree:
Times included shows how many source files include the header in the top-level node through the path to the current node. In the example above, catch_common.h was included in 75 source files in total, of which 26 included catch_common.h through the
#include "catch_common.h"directive in catch_tag_alias_autoregistrar.h.Line contribution shows how many lines of code the header in the top-level node contributed through the path to the current node by itself, without transitively included files. catch_common.h contributed 4,050 lines of code in total, which is 75 (the number of source files that include it) times 54 (the number of lines of code in the file). Out of 4,050 in total, 1,404 lines were contributed because of
#include "catch_common.h"in catch_tag_alias_autoregistrar.h.Line contribution inclusive is similar to Line contribution, but this metric takes into account all headers transitively included in the file in the top-level node. For example catch_common.h, together with the headers included in it, contributes 2,654,938 lines in total during compilation of the entire solution. 1,017,626 of those lines were contributed because of
#include "catch_common.h"incatch_tag_alias_autoregistrar.h. Line contribution inclusive is the default and arguably the most useful sorting criteria.
Includers view
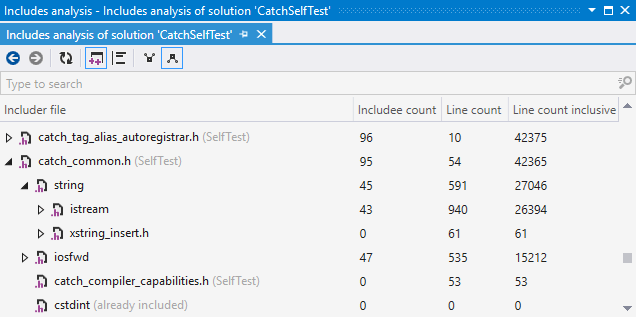
The Includers view is similar to the Includees view, but acts in the opposite way: the child nodes inside the tree represent files which are included in the file from the parent node.

This view shows how many lines of code are transitively included in the file in a top-level node as if it was compiled as a standalone source file (for example catch_common.h together with all headers included in it comprises 42,365 lines of code, of which 27,046 were brought with #include<string>). The metrics that this view provides are
Includee count (the number of included files),
Line count (the size of the file itself),
Line count inclusive (the size of the file with all the header files it includes).
Options
In addition to navigation controls and the refresh button, the toolbar in the Includes analysis window lets you change two options:
Show only root nodes belonging to some project will hide top-level tree nodes that correspond to files not belonging to any project. This is a quick way to filter out library files if you want to focus on headers inside your solution.
By default, ReSharper skips blank lines and comments during an analysis. The Count blank and comment lines button lets you change this behavior.