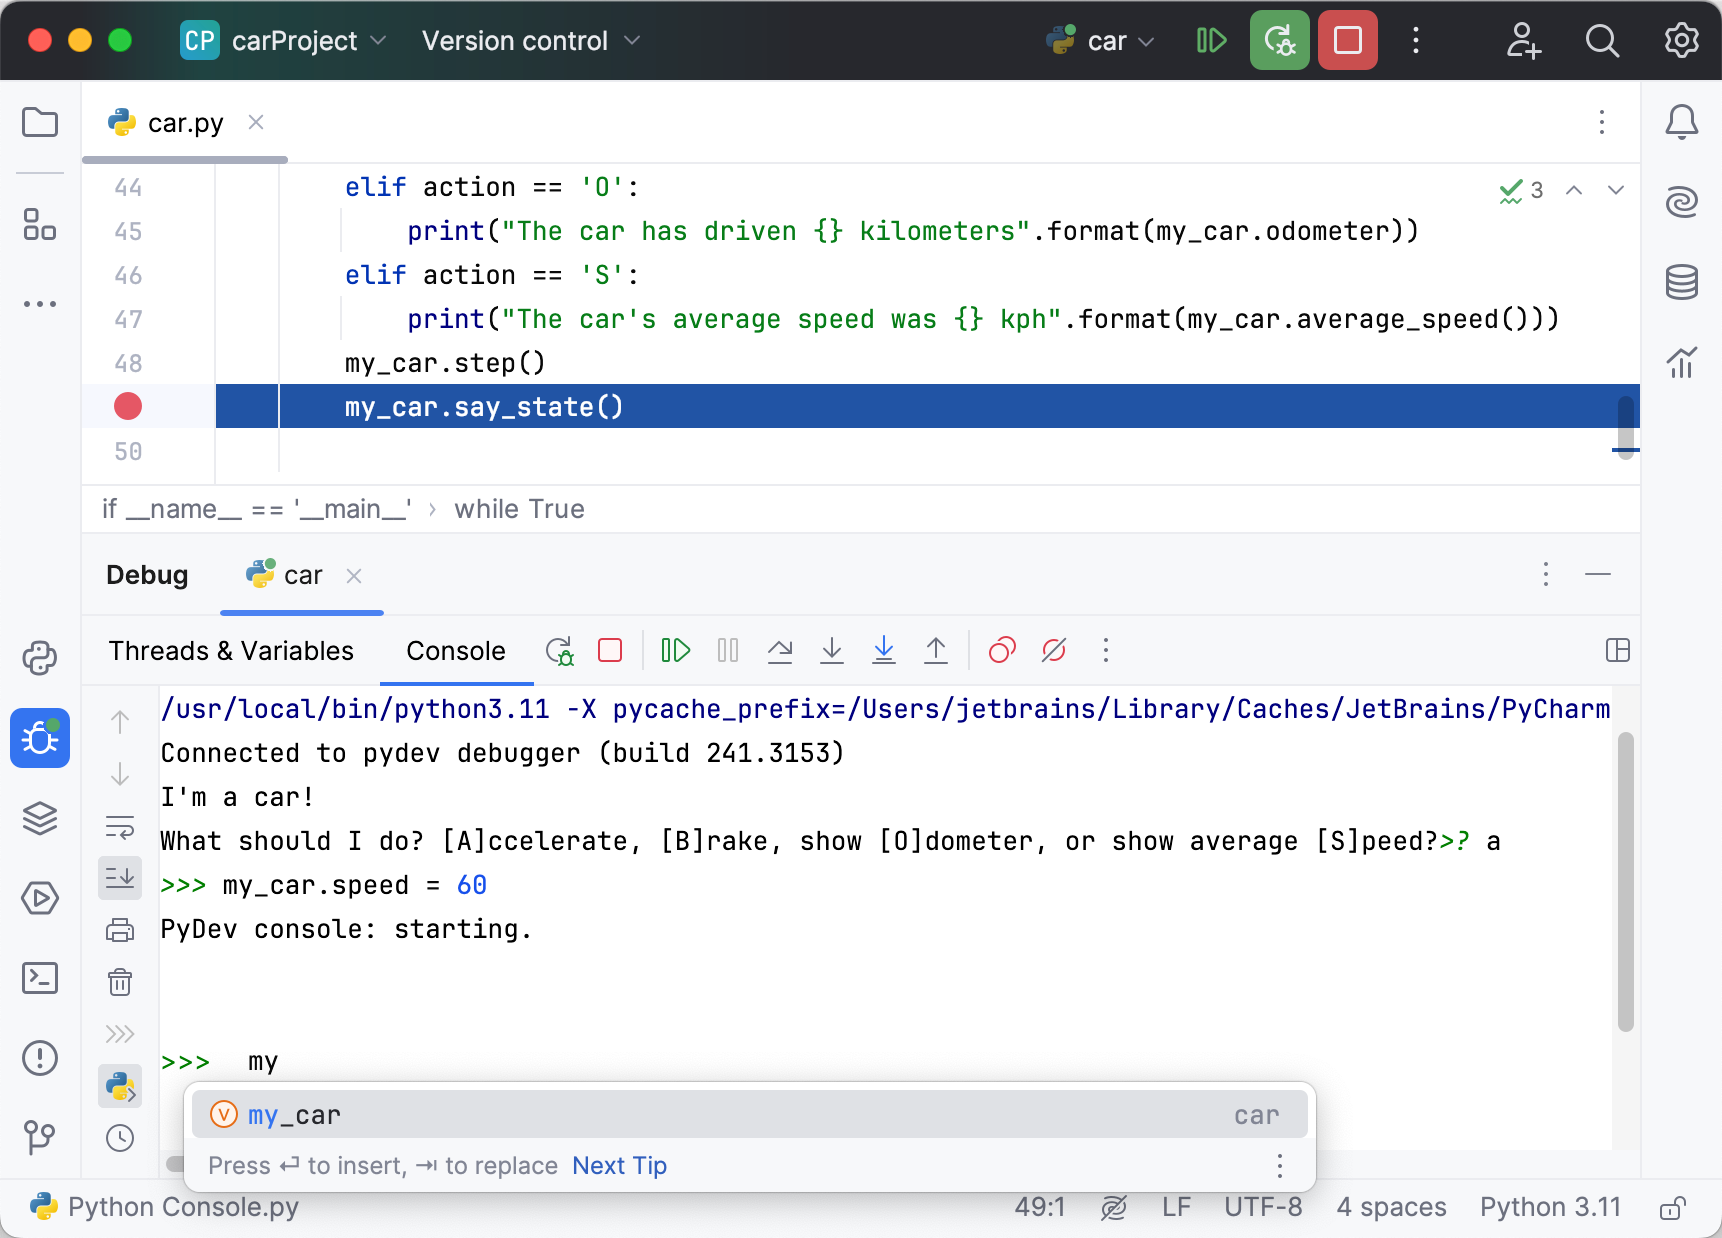
Using Debug Console
The Debug Console enables you to view the output and error messages.
Opening the Debug Console
When you start the debugging session, PyCharm launches the debug console.
By default, the console is interactive. It will show prompt where you can execute commands using code completion.

You can disable this behavior by clicking Show Debug Console.
Actions available in the Debug Console
In the console, you can:
Type commands and press Enter to execute them. Results are displayed in the same console.
Use basic code completion Ctrl+Space and tab completion.
Run asyncio coroutines.
Use Up and Down to scroll through the history of commands, and execute the required ones.
Load source code from the editor into console.
Use the context menu to copy the contents of the console to the clipboard, compare it with the clipboard, or clear the console.
Use the toolbar buttons to control your session in the console.